FETUSDT trade ideas

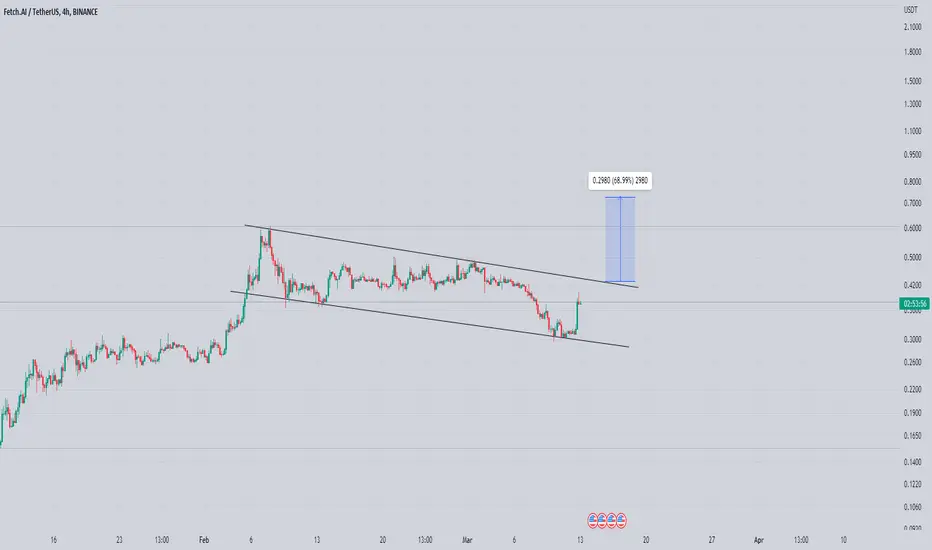
Probable path of FetI believe the correction is not completed. we are in wave C of wave x and then finally down movement to 0.29
Target- .52
Stoploss - 0.36

FET - Trade setupThe idea is: Buy when the price breaks above 0.395$ and take profits at the levels shown in the chart.
Targets:
1. 0.4$
2. 0.41$
3. 0.42$
4. 0.4375$
5. 0.46$
-------------------------------------------
Key Dates to Watch in March:
30 Mar: GDP Report
-------------------------------------------
If you like the content, then make sure to comment and like the post :D
Follow me for daily profitable trading setups.
BTC dictates the market. If BTC falls, then Alts will drop as well. Trade safe!

FET/USDT explosion on the wayFET is the native token of the Fetch.AI platform, a decentralized network that enables digital agents to autonomously perform complex tasks. These agents can be programmed to interact with one another and with real-world devices, creating a highly efficient and secure ecosystem for data exchange and value transfer.
The Fetch.AI platform uses advanced machine learning and artificial intelligence technologies to enable agents to learn from their environment and adapt to changing conditions. This allows them to perform tasks such as asset tracking, supply chain optimization, and energy management with minimal human intervention, saving time and resources for businesses and organizations.
The FET token is an integral part of the Fetch.AI ecosystem, serving as a means of exchange for goods and services within the network. It is also used to incentivize agent behavior, encouraging agents to perform tasks that benefit the overall ecosystem.
In addition to its utility within the Fetch.AI platform, the FET token has also gained popularity as a speculative investment asset. Its value is determined by market forces such as supply and demand, and is subject to fluctuations based on various factors such as network usage, adoption rate, and overall market sentiment.
Overall, the Fetch.AI platform and the FET token offer an innovative solution to the challenges of data exchange and value transfer in today's digital economy. With its advanced technology and autonomous agents, Fetch.AI has the potential to revolutionize industries such as logistics, transportation, and energy management, while providing a secure and efficient platform for businesses and organizations to operate on.

fetchShort all crypto especially this one. Yep, It will go back to the start at pennies. I sold all.


FET/USDT A caged beast - 4 USDTTHE TOKEN FET OF THE COMPANY FETCH.AI It is a beast that has not yet been released, even with the expansion its value can exceed 4 USDT
FETCH.AI is a leading decentralized platform that utilizes artificial intelligence (AI) and blockchain technology to enable autonomous machine communication and coordination. The platform provides a more efficient and effective way for machines to communicate with each other and make decisions, opening up exciting new possibilities for various industries. Here are 20 examples of how FETCH.AI is transforming industries:
Autonomous vehicles: FETCH.AI enables self-driving cars to communicate with each other, creating a more efficient and safe transportation system.
Supply chain management: The platform facilitates real-time tracking of goods and enables automated decision-making in logistics.
Smart homes: FETCH.AI can help smart devices in homes communicate with each other, allowing for a more seamless and personalized experience.
Healthcare: The platform can facilitate the secure sharing of medical data and enable more efficient communication between healthcare providers.
Finance: FETCH.AI can facilitate faster and more secure transactions, reducing the need for intermediaries.
Energy management: The platform can optimize energy usage and enable more efficient management of energy grids.
Advertising: FETCH.AI can facilitate more personalized and targeted advertising, based on real-time data.
Agriculture: The platform can optimize crop yields and enable more efficient management of farms.
Gaming: FETCH.AI can enable more immersive and interactive gaming experiences, based on real-time data and AI.
Insurance: The platform can enable more accurate and personalized risk assessment, based on real-time data.
Smart cities: FETCH.AI can facilitate more efficient and sustainable management of cities, based on real-time data and AI.
Retail: The platform can enable more personalized and targeted customer experiences, based on real-time data and AI.
Travel: FETCH.AI can enable more seamless and personalized travel experiences, based on real-time data and AI.
Education: The platform can facilitate personalized and adaptive learning experiences, based on real-time data and AI.
Telecommunications: FETCH.AI can optimize network usage and enable more efficient communication between devices.
Manufacturing: The platform can enable more efficient and sustainable manufacturing processes, based on real-time data and AI.
Real estate: FETCH.AI can facilitate more efficient and transparent real estate transactions, based on real-time data and AI.
Logistics: The platform can optimize logistics operations and enable more efficient transportation, based on real-time data and AI.
Entertainment: FETCH.AI can enable more immersive and interactive entertainment experiences, based on real-time data and AI.
Human resources: The platform can facilitate more efficient and personalized recruitment and talent management, based on real-time data and AI.
Overall, FETCH.AI is revolutionizing various industries by enabling autonomous machine communication and coordination, powered by AI and blockchain technology. The potential applications of this technology are endless, and we can expect to see more exciting innovations from FETCH.AI in the future.

IDEA: 03/19 - FET/USDT explosionArtificial intelligence (AI) and blockchain technology have the potential to create a new era of innovation and transformation. One company that is at the forefront of this movement is FETCH AI, with their FET token.
FETCH AI is a decentralized platform that utilizes AI and blockchain technology to create a smart ledger for autonomous machine communication and coordination. This platform enables machines to autonomously discover and communicate with each other, facilitating more efficient and effective decision-making.
The FET token serves as the native currency of the FETCH AI network, providing a means of payment for machine-to-machine transactions and incentivizing network participation. With a strong team and partnerships in various industries, FETCH AI is poised to become a leader in the AI and blockchain space.
Overall, the combination of AI and blockchain is a powerful force for change, and FETCH AI is driving this movement forward. The FET token is a promising investment for those looking to participate in this exciting and transformative field. As more industries adopt AI and blockchain technologies, FETCH AI is well-positioned to play a key role in shaping the future.

✴️ Fetch.AI Next Target Mapped ($0.8340) | Already 1,050%+FETUSDT has been one of the strongest Altcoins in this recovery phase.
We say recovery phase but in this case, FETUSDT is already in a bull market.
What one does, the rest follows.
What you see happening here is what the rest of the market will do, Bitcoin and the Altcoins vs Tether (ALTSUSDT) pairs.
✔️ So far FETUSDT has grown by 1054% since its November 2022 bottom low, this is not bear market type of action.
All the signals continue 100% bullish and thus we proceed to map the next target.
The current price remains above EMA10.
The MACD is bullish and has plenty of room available for additional growth.
The RSI ultra bullish as well.
✔️ The next target is set here at $0.8343... Depending on how this level is handled, there can be more.
Namaste.

FETUSDT 1D ANALYSISGuys if you know, I like this coin very much But here's my idea in mid-term. I think this bull Trend which has multipled the price 10 times already is coming to an end. (Probably in the red zone) and I personally (N.F.A) think that these prices are pretty high for this coin, right now.
As you see, FET whales have a tendency to correct 50% of the main bullish waves when they finish. So that's exactly where we will be waiting to buy back this coin.
Enjoy

FET/BUSD Buyers in charge of FETFETCH.AI is a decentralized platform that uses artificial intelligence and machine learning to provide smart solutions for various industries. Here are some advantages of using FETCH.AI and its native token FET:
Scalability: FETCH.AI uses a unique multi-chain architecture that enables it to handle high volumes of transactions, making it ideal for enterprise-level use cases.
AI-powered: FETCH.AI leverages the power of AI and machine learning to provide smart solutions for various industries, such as supply chain, mobility, and finance.
Privacy and security: FETCH.AI provides a secure and private environment for conducting transactions and exchanging data, using advanced encryption techniques and decentralized identity management.
Staking rewards: FET token holders can earn rewards by staking their tokens, providing liquidity to the network and participating in governance activities.
As for the size of the crypto market, it has grown significantly over the past few years. According to CoinMarketCap, the total market capitalization of all cryptocurrencies as of March 17, 2023, is approximately $4.8 trillion. The advantages of using cryptocurrencies include:
Decentralization: Cryptocurrencies are decentralized, meaning they are not controlled by any central authority, providing greater freedom and autonomy to users.
Security: Cryptocurrencies use advanced encryption techniques and decentralized networks to provide secure and private transactions, protecting users' assets and personal information.
Global accessibility: Cryptocurrencies can be used by anyone with an internet connection, regardless of their location or financial status, providing greater financial inclusion and accessibility.
Transparency: Cryptocurrencies use public ledgers to record transactions, providing greater transparency and accountability than traditional financial systems.
Overall, the advantages of using cryptocurrencies and blockchain technologies such as FETCH.AI and FET tokens are significant, offering greater scalability, security, privacy, and accessibility than traditional systems.

$FET - reclaim of the rangeAfter the range reclaim and use of the lower boundary as support, the target is the upper boundary w/ a RR of 2 and a rather high likelyhood.

Buyers again in FET/BUSD controlIntelligence in the field of technology has come a long way, with advancements in artificial intelligence (AI) and blockchain technology leading the way. These two technologies, when combined, have the potential to revolutionize the way we live and work.
One company at the forefront of this exciting field is FET FETCH.AI, which is using AI and blockchain to create decentralized autonomous agents (DAAs) that can interact with each other and perform tasks autonomously. These agents can be used in a wide range of applications, from logistics and supply chain management to energy and finance.
The benefits of using AI and blockchain in this way are many. Decentralization means that there is no single point of failure, making the system more robust and secure. AI enables the agents to learn from their interactions and adapt to changing circumstances, making them more effective over time. And blockchain provides an immutable record of all transactions, ensuring transparency and accountability.
But the potential of AI and blockchain goes beyond just DAAs. AI can be used to analyze vast amounts of data, providing insights that were previously impossible to obtain. Blockchain can be used to create secure, tamper-proof records of those insights, making them more trustworthy and valuable.
Overall, the combination of AI and blockchain has the potential to create a more efficient, transparent, and equitable world. And companies like FET FETCH.AI are at the forefront of this exciting new field, pushing the boundaries of what is possible and paving the way for a brighter future.

Fet going to drop again.Fet will be going to hit .25 target in next days. The final wave of correction started and it may possible Fet can go below .25 also.

Fet Getting Ready For Another Bullish Impulse seems Like fet Getting Ready For Another Bullish impulse
Forming Bullish Flag In h4 Timeframe Incase Of breakout Expecting 40 to 45% bullish Move
FET/USDT Chart Hi, I try to post often so if you could follow and like it would mean a lot to me.
A few days ago I posted an idea about BTC going up and it did better than I expected. Now I expect BTC to cool off in the next days while alts perform. Then we will see which direction the market goes. (I will update when that happens so stay tuned).
FET is a great AI project that I believe it will do well in the next days. In the 4H chart things might drop a little bit in the next hours but daily chart is looking preety consistent. MACD is about to cross like it did on bitcoin so now its time to altcoins pump. Comment what you think and if you have any suggestions about how to improve the content feel free to ask.

FetUsdtFet can touch first targets before Correction only need break resistance and this resistance not hard
this analyse for request frind
i hop can help you
GL
EntryPoint:
0.4042
Supports:
0.3898
0.3610
0.3405
0.3204
Resistance:
0.4455
Targets:
0.4909
0.5628
0.6713
Midtime:
0.8394
0.9431
1.1143
1.5242
GL

FET/USDT explosion on the wayArtificial Intelligence (AI), Bitcoin, and Fetch.ai are all innovative technologies that have the potential to revolutionize the world we live in.
AI has already shown its incredible potential in a variety of fields, from healthcare to finance to transportation. With its ability to process vast amounts of data quickly and accurately, AI is helping researchers make breakthrough discoveries, assisting doctors in diagnosing illnesses, and aiding businesses in making data-driven decisions that improve their bottom line. As AI continues to evolve and become more sophisticated, its potential applications are virtually limitless.
Bitcoin, on the other hand, is a decentralized digital currency that has disrupted traditional financial systems. It offers a secure and efficient way to conduct financial transactions, without the need for intermediaries such as banks. The technology behind Bitcoin, known as blockchain, has also opened up new possibilities for secure and transparent record-keeping and has been adopted by a wide range of industries, from healthcare to real estate.
Fetch.ai is a blockchain-based platform that combines AI with decentralized ledger technology to create a more efficient and intelligent internet. By harnessing the power of AI, Fetch.ai is enabling businesses and organizations to automate a wide range of tasks and processes, making them more efficient and cost-effective. Its decentralized nature also ensures greater privacy and security, as users retain control over their data.
In conclusion, AI, Bitcoin, and Fetch.ai are all exciting and innovative technologies that have the potential to transform the way we live and work. While there are certainly challenges and risks associated with these technologies, their potential benefits far outweigh the negatives. With continued investment and development, we can look forward to a future where AI, Bitcoin, and Fetch.ai play a central role in shaping a better world.

FET/USDTFet was on of the best performers this run and I'm expecting a big correction soon.
The AI narrative is over and the bubble is bursting.
I will use a larger SL beacuse it's not so liquid and could see some spikes up if there is some liquidity left.
It's still ranging but I'm expecting that it will start trending down soon.
My first target will be at $0.28. That's the Mid Range.
Follow, like the idea and feel free to leave a comment.
Check out other ideas if you like this one.

FET/USDT explosion on the wayUnderstand the Purpose: FET is the native token of the Fetch.ai network, which is a decentralized platform for AI and blockchain solutions. Before investing or using FET, it's important to understand the purpose of the network and how FET fits into it.
Research the Market: Like any cryptocurrency, the value of FET is subject to market fluctuations. It's important to stay up-to-date on the market trends and news that may affect the value of FET.
Consider the Risks: Cryptocurrencies are known for their volatility, and FET is no exception. Before investing, make sure to understand the risks involved and only invest what you can afford to lose.
Choose a Reputable Exchange: If you're looking to buy or trade FET, make sure to choose a reputable cryptocurrency exchange. Research the exchange's security measures and user reviews before making any transactions.
Store Your FET Securely: Once you have purchased FET, make sure to store it in a secure wallet. Consider using a hardware wallet for added security.
Explore the Fetch.ai Platform: If you're interested in using FET to access AI and blockchain solutions on the Fetch.ai platform, take the time to explore the platform and its offerings. Familiarize yourself with the various services and their pricing structures.
Keep Learning: The world of cryptocurrency and blockchain technology is constantly evolving. Stay informed and continue learning about FET and other cryptocurrencies to make informed decisions.

FET can make a doji candlestick patternIf you swallow the previous days, there's a MEGA explosion! You can go above $2 Came to clear the levers and go back up.
And to show that blockchain AI is just getting started has USD billions to go in for AI.
Let's follow the graph and come back with an update.


Fetch.ai : Ready for Top-100 Every dip and every major correction/FUD comes to opportunity and that today could be FET:
I see support at 0.337 and that allows me a trade (i still use a stop loss and that would be 0.298 in this case).
My chart shows targets at 0.57 - 0.71 and 0.88 for now.
Off course first comes the fundamental analysis:
Crypto is taking a beating and some alts will go to zero. Some others will do well and FETCH.AI is in the second category, those I like to carry.
Artificial Intelligence is a 'trending reality' and probably the crypto category that might be able to survive and (why not) thrive in the next cycle.
What Makes Fetch.ai Unique?
Fetch.ai’s utility token FET was designed to find, create, deploy and train digital twins and is an essential part of smart contracts and oracles on the platform.
Through the usage of FET, users can build and deploy their own digital twins on the network. Developers, by paying with FET tokens, can access machine-learning-based utilities to train autonomous digital twin and deploy collective intelligence on the network.
Validation nodes are also enabled by staking FET tokens, which facilitates network validation and reputation as a result.
The Fetch.ai technology stack has four distinct elements, which are:
The Digital Twin Framework — provides modular components that help teams build marketplaces, skills, and intelligence for digital twins to connect with.
The Open Economic Framework — provides search and discovery functions to digital twins.
The Digital Twin Metropolis — a collection of smart contracts that run on a WebAssembly (WASM) virtual machine to maintain an immutable record of agreements between digital twins.
The Fetch.ai Blockchain — combines multi-party cryptography and game theory in order to provide secure, censorship-resistant consensus as well as rapid chain-syncing to support digital twin applications.
When it comes to the platform’s core components, there is the learner where each participant is the learner in the experiment, representing a unique private dataset and machine learning system. There is also the global market, which is the result of a collective learning experiment, where the machine learning model is trained collectively by the learners themselves. Next, there is the Fetch.ai Blockchain that supports smart contracts which permit coordination and governance in a secure and auditable way. Lastly, there is the decentralized data layer based on IPFS which enables the sharing of machine learning weights between all of the learners involved.
One Love,
The FXPROFESSOR
PS. THE MARKET IS NOT GREAT..That's still ok when research is done and charts are used properly. Remember to risk with care
