$WIF Liquidity sweeps pumping
See last post wif
Amazing trend and chart exactly following trend same as before published chart
FETUSDT trade ideas

FetIf were lucky we ca. See some upward momentum unless it closes otherwise we're going. Belpe tp support

Buy it cheaperFET is about to hit 30 cents, buy it cheaper while you can.
Target is 61.8 Fibonacci of the Impulse down.

Counter-Trend trade FET to $1.40FET seems to have made its way into its very on bear market. It did it all by its self. Aren't you proud of it? lol
.63-.90 was an area of interest here for me when I'd shorted it, and also longed it previously. I think that this area again is a nice place to take a long from.
I think that we can probably hit around $1.40 from here, where I think that then FET will continue down afterward.
Enter anywhere under .815 cents down to .60 cents.
Thank you!

FET - buy from .17-.31 cents after it tests 1.05-1.08FET entered a bear market all on its own. Aren't you proud of it? Lol.
The way things are looking for it now, I could see it doing a counter-trend up to about 1.05-1.08, and then continuing a down move.
I think that a prime opportunity can be had around .176 - .31 cents.
I will be looking again when/if we get there for confluence.
Thanks for looking!

DeepSeek AI collapse. The DeepSeek fud has taken its tole and the AI sector. The ship is sinking. Fear is all around.
FET/USDT Looks like FET is ready for the party. DB possible and then we are on. Last up circle last 55 days. Let's see how this plays out.

FETFET is one of the clearest bullish looking crypto i analyzed today so lets hope in brings joy,
so, two targets on this chart however im cofindent the price can surpass the first
good luck

FET Fetch way oversold. Catching knives!FET Fetch way oversold. Catching knives! FET is a solid project that has dumped due to the AI FUD. I think this is a great area to load up on spot. A break of the trendline could easily get us back to 10-20% on spot (100-200% on 10x). Careful trying to catch knives though!

good trade for $FETFET is following the trend, if good news are remaining, this is a good buy zone opportunity to make some $$ once it breaks the resistance.

#FET/USDT
#FET
The price is moving in a descending channel on the 1-hour frame and is adhering to it well and is heading to break it strongly upwards
We have a bounce from the lower limit of the descending channel, this support is at a price of 1.00
We have a downtrend on the RSI indicator that is about to be broken, which supports the rise
We have a trend to stabilize above the moving average 100
Entry price 1.05
First target 110
Second target 1.16
Third target 1.22

#FET/USDT Ready to go higher#FET
The price is moving in a descending channel on the 1-hour frame and sticking to it well
We have a bounce from the lower limit of the descending channel, this support is at 1.26
We have a downtrend on the RSI indicator that is about to be broken, which supports the rise
We have a trend to stabilize above the 100 moving average
Entry price 1.28
First target 1.33
Second target 1.37
Third target 1.44

Time to BUY Fetch_aiHi fellow traders, FETUSDT is ready to make a move higher after completing the smaller correction. Target the 4 USDT level. Good luck and trade safe!


FET and why we can see - 70% again? BINANCE:FETUSDT
Possible Targets and explanation idea
➡️ Weekly fib legit. After AI narrative we saw perfect test 0.618 lvl
➡️ Still didn't sweep liquidity in 0.27 zone.
➡️ We can close at least 2 of green weekly gaps at least -70% again
➡️ Fundamental value based on Take Profit indicator last yellow line 0.14$
➡️ All lines are dynamic. After sweep liquidity at the bottom road will be open to weekly gap over 0.70$
Hope you enjoyed the content I created, You can support with your likes and comments this idea so more people can watch!
✅Disclaimer: Please be aware of the risks involved in trading. This idea was made for educational purposes only not for financial Investment Purposes.
---
• Look at my ideas about interesting altcoins in the related section down below ↓
• For more ideas please hit "Like" and "Follow"!

TRADE PLAN FOR FET FOR PROFITSHello traders, Another opportunity on FET , we trade what the chart tells us.
Enjoy.
Tradehubng

TradeCityPro | FET: Exploring the AI-Driven Ascendancy👋 Welcome to TradeCityPro!
In this analysis, I will examine the coin FET, a project within the artificial intelligence sector that experienced significant growth during last year's AI hype.
📅 Weekly Timeframe
In the weekly timeframe, we see an ascending trend line starting from a low of $0.058 and extending to a new ATH at $3.099. Currently, the price has responded to this region during a corrective phase, but it has technically broken this trend line in terms of time.
🔍 Although the price is no longer above the ascending trend line, it does not signify a definitive break of the trend line as the drop and bullish momentum have not directly caused a breach. The price range has resulted in a temporal break, so I personally do not consider the trend line broken yet and will wait to observe clear price momentum.
📊 Should the price gain upward momentum and the RSI return above 50, we can anticipate a rise to retest the $3.099 resistance. If this movement occurs alongside an increase in buying volume, the price might even break above this level. In such a scenario, the Fibonacci 1.0 target, which is approximately $12.6, could be reachable.
🔽 In case of further correction, the initial support is at $0.810, a significant PRZ overlapping with the Fibonacci 0.5 area. If this level breaks, subsequent supports at Fibonacci 0.618, identified on the chart as $0.488, will be tested. A break below $0.488 could signal a bearish phase as the next major support lies at $0.185. The first trigger for bearish momentum entering the market would be a break below 44.12 on the RSI.
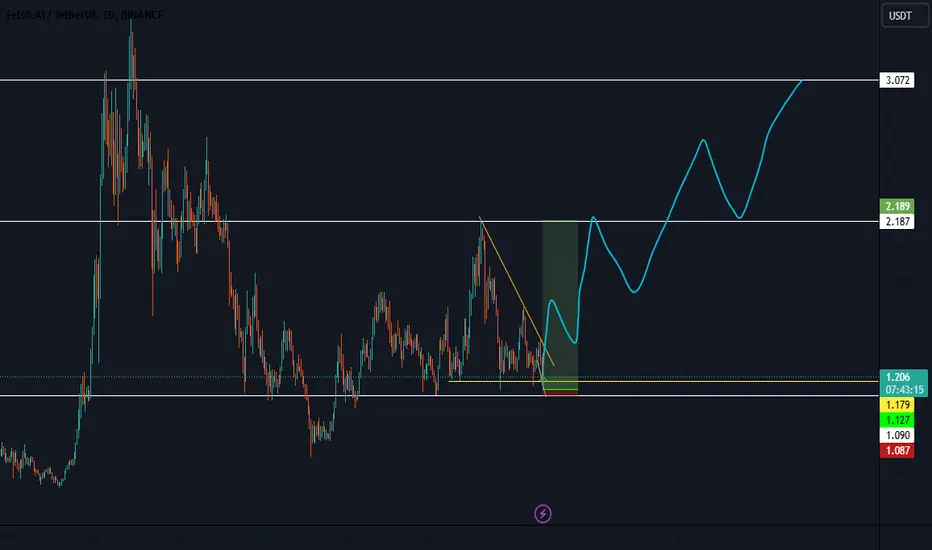
📅 Daily Timeframe
The daily timeframe displays a range between $1.114 and $2.165. Currently, the price is at the lower end of this box, forming a descending trend line. If the price is supported at the box’s base and breaks the trend line, we can expect a move towards the upper boundary, supported by good buying volume.
🔼 If the trend line is broken, the first long position trigger is at $1.408. Concurrent breakage of this support with the RSI surpassing 50 would serve as a robust confirmation.
📉 Moreover, the bearish momentum in the market is significant, weakening the $1.114 support with repeated tests. A breach here could lead to price declines toward $0.810 and $0.488.
🧩 Overall, movements of altcoins like FET, which have a market cap below $10 billion, are greatly influenced by indices like TOTAL and TOTAL2. Thus, it is advisable to take cues from broader market indices and major coins like Bitcoin and Ethereum before making entry decisions in such altcoins.
📝 Final Thoughts
This analysis reflects our opinions and is not financial advice.
Share your thoughts in the comments, and don’t forget to share this analysis with your friends! ❤️

FET ChallengeFET moves into a decreasing triangle; if it breaks this trend, it could go to the illustrated target.


FETHi
bullish signals from RSI is evident
price is below the 50 and 200 Moving average therefore increasing the chances for buy since buyers can earn FET for cheap
two possible scenarios but I favour the 3.2 Target
good luck

FET/USDT Trade IDEA, AI coin for BULL run FET have strong potential in the AI sector and weekly chart looks good for buying for the coming bull run investment.
key area for FET need to hold at 1,
otherwise, it will go down further

Is FET About to Bounce or Break Down Completely?Yello, Paradisers! FETUSDT is at a make-or-break point right now. The recent retracement looks healthy, and the pair has taken out liquidity (inducement) from weaker hands. But can it hold this support zone and bounce?
💎If we start seeing bullish signs such as a bullish I-CHoCH (internal change of character) or reversal patterns like a W pattern or an inverse head and shoulders on the lower timeframes, the probability of a bullish move significantly increases.
💎However, be prepared for more retracement or panic selling. If that happens, the next strong support zone could trigger a bounce, but again—we need to see bullish confirmations on lower timeframes to consider entering long positions.
💎If the price breaks below the key support zone and closes candles underneath it, the entire bullish idea will be invalidated. In that case, it’s best to stay patient and wait for better price action to form before making any moves.
🎖Patience and discipline are the keys here, Paradisers. Always wait for the highest probability setups to reduce risk and increase your edge. Remember, it’s not about predicting the market—it’s about reacting to what the market gives you.
MyCryptoParadise
iFeel the success🌴
