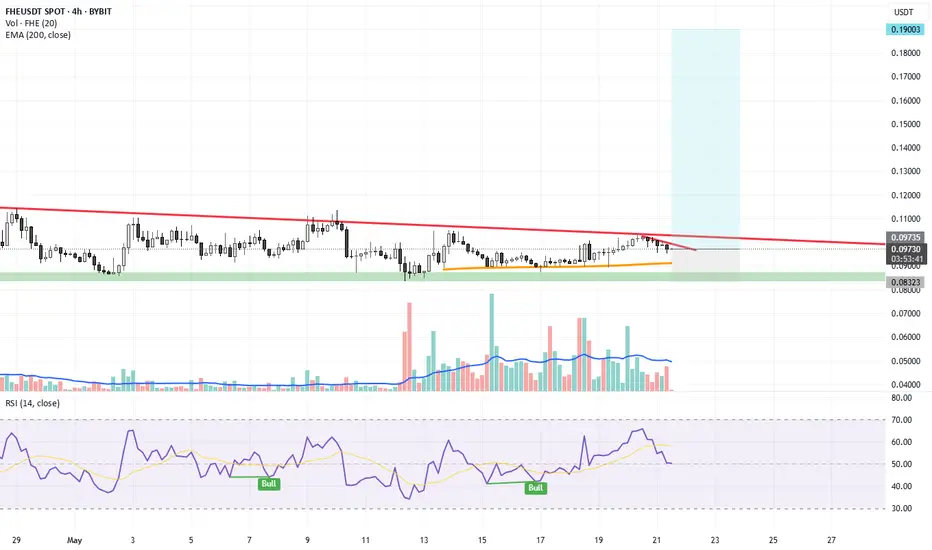
FHE Analysis (4H)A major structure in FHE has turned bearish, and the price is currently pulling back to a fresh and untouched order block. Additionally, the price is trading below supply zones on higher timeframes.
A drop toward the specified targets and the green zone is expected, as long as the red box is mainta
Related pairs

$FHE 6h chart setup. The ASX:FHE 6h chart is showing a potential breakout setup.
Price has held strong at the $0.06963–$0.07132 support zone and is now testing the descending trendline resistance around $0.07600.
A breakout above this level could trigger a 54% rally toward $0.112.
Watch closely, a move above the

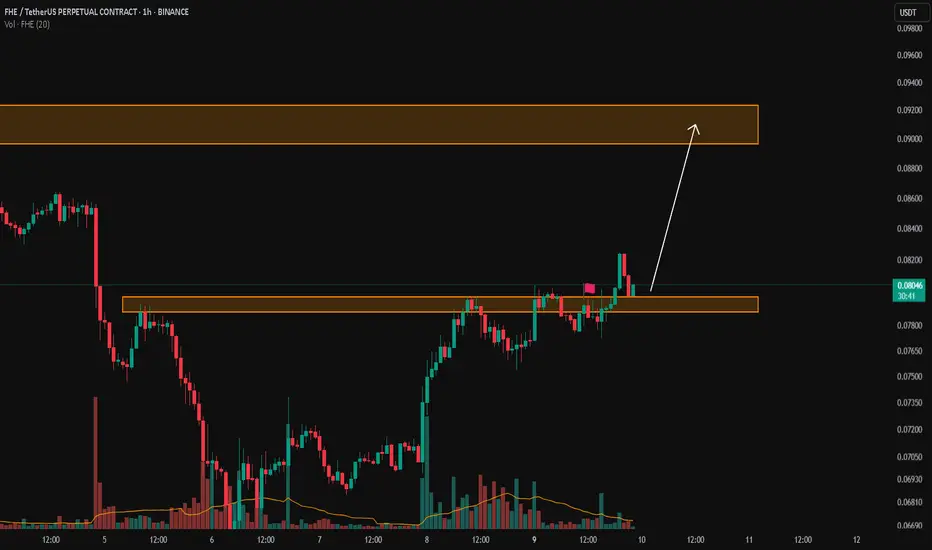
FHE/USDTKey Level Zone: 0.07880 - 0.07970
The setup looks promising—price previously trended upward with rising volume and momentum, then retested this zone cleanly. This presents an excellent reward-to-risk opportunity if momentum continues to align.
Introducing LMT (Levels & Momentum Trading)
- Over the
FHE USDTCP 0.09710
Buy 0.1 TO 0.096
sell 0.019
Stop Loss 0.08323
|Good project with Huge potential.
Spot Trade Only.
$FHE/USDT Chart Update$FHEUSDT/USDT Chart Update
Strong bounce from the demand zone
6h structure holding firm with a clear bullish reaction
Entry: $0.095–0.097
SL: $0.08615
TP: $0.18484+
It looks ready to explode, so don’t sleep on this one! 👀
DYRO, NFA

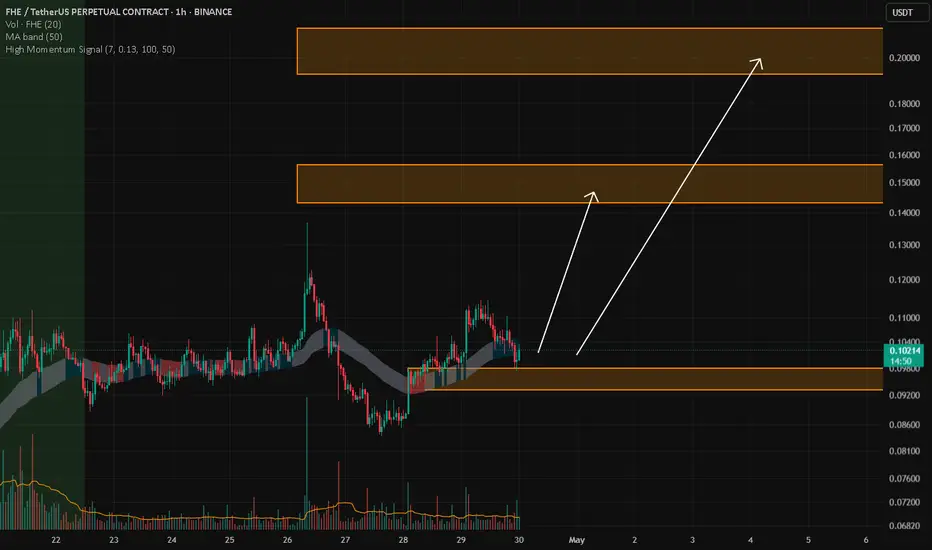
$FHE/USDT Bullish Breakout Setup$FHE/USDT Bullish Breakout Setup
Price just broke out of a symmetrical triangle after days of tight consolidation.
Momentum is building, this looks ready to fly. 🚀
- Entry: CMP
- Target: $0.18
- SL: $0.091
High RR setup. Watch closely. DYRO, NFA

FHE/USDTKey Level Zone: 0.09320 - 0.09790
HMT v8.1 detected. The setup looks promising, supported by a previous upward/downward trend with increasing volume and momentum, presenting an excellent reward-to-risk opportunity.
HMT (High Momentum Trending):
HMT is based on trend, momentum, volume, and market s
FHE PERPETUAL TRADE Sold at $0.088FHE PERPETUAL TRADE
FHEUSDT SELL SETUP
Currently $0.087
Sold at $0.088
(Trading plan If FHE/USDT up to $0.10 we will add more shorts)
Expecting target $0.08 OR DOWN
Incase of early exist will update this anaylsis
Its not a Financial advice

FHE/USDT Analysis – High Probability of a Bullish Trend
This futures pair is showing strong signs of entering a full-fledged bullish trend.
We are currently attempting to break through the key level of $0.078.
Below that, a strong volume zone has formed at $0.0756–$0.072, which is now acting as support.
We're looking at a potential long position up

Fibonacci Retracement Points to $0.0000010 TargetAnalysis:
ASX:FHE ’s 1-day chart shows the price at $0.00000079, near the 61.8% Fibonacci retracement level from a prior swing high ($0.0000015) to low ($0.00000050). A bounce from this level could target the 38.2% retracement at $0.0000010. RSI is neutral at 42.
Actionable Insight:
Long at $0.0000

See all ideas
Summarizing what the indicators are suggesting.
Oscillators
Neutral
SellBuy
Strong sellStrong buy
Strong sellSellNeutralBuyStrong buy
Oscillators
Neutral
SellBuy
Strong sellStrong buy
Strong sellSellNeutralBuyStrong buy
Summary
Neutral
SellBuy
Strong sellStrong buy
Strong sellSellNeutralBuyStrong buy
Summary
Neutral
SellBuy
Strong sellStrong buy
Strong sellSellNeutralBuyStrong buy
Summary
Neutral
SellBuy
Strong sellStrong buy
Strong sellSellNeutralBuyStrong buy
Moving Averages
Neutral
SellBuy
Strong sellStrong buy
Strong sellSellNeutralBuyStrong buy
Moving Averages
Neutral
SellBuy
Strong sellStrong buy
Strong sellSellNeutralBuyStrong buy
Frequently Asked Questions
The current price of FHEUSDT SPOT (FHE) is 0.07636 USDT — it has risen 1.06% in the past 24 hours. Try placing this info into the context by checking out what coins are also gaining and losing at the moment and seeing FHE price chart.
FHEUSDT SPOT price has risen by 3.62% over the last week, its month performance shows a 8.37% increase, and as for the last year, FHEUSDT SPOT has increased by 663.60%. See more dynamics on FHE price chart.
Keep track of coins' changes with our Crypto Coins Heatmap.
Keep track of coins' changes with our Crypto Coins Heatmap.
FHEUSDT SPOT (FHE) reached its highest price on Apr 26, 2025 — it amounted to 0.13603 USDT. Find more insights on the FHE price chart.
See the list of crypto gainers and choose what best fits your strategy.
See the list of crypto gainers and choose what best fits your strategy.
FHEUSDT SPOT (FHE) reached the lowest price of 0.01000 USDT on Apr 10, 2025. View more FHEUSDT SPOT dynamics on the price chart.
See the list of crypto losers to find unexpected opportunities.
See the list of crypto losers to find unexpected opportunities.
The safest choice when buying FHE is to go to a well-known crypto exchange. Some of the popular names are Binance, Coinbase, Kraken. But you'll have to find a reliable broker and create an account first. You can trade FHE right from TradingView charts — just choose a broker and connect to your account.
FHEUSDT SPOT (FHE) is just as reliable as any other crypto asset — this corner of the world market is highly volatile. Today, for instance, FHEUSDT SPOT is estimated as 1.89% volatile. The only thing it means is that you must prepare and examine all available information before making a decision. And if you're not sure about FHEUSDT SPOT, you can find more inspiration in our curated watchlists.
You can discuss FHEUSDT SPOT (FHE) with other users in our public chats, Minds or in the comments to Ideas.