FIDAUSDT Forming Falling WedgeFIDAUSDT is emerging as a strong contender for mid-term bullish momentum as technical and fundamental indicators start aligning in favor of buyers. FIDA, the native token of the Bonfida ecosystem, has shown consistent development progress and increasing adoption, especially in the Solana-based DeFi space. With good volume surging around current levels, it's evident that investors are gradually accumulating, possibly in anticipation of a breakout move. The current structure suggests a price recovery setup that could result in a significant gain between 90% to 100% or more.
Market participants have started showing increasing interest in the project as FIDA continues to build utility around its decentralized exchange tools, API integrations, and naming services. Historically, FIDA has responded well to increased on-chain activity and ecosystem expansion, and recent volume inflows may signal renewed momentum. Traders are watching key resistance levels closely, which, once broken, could confirm the bullish reversal.
Technically, the price has found support at a strong demand zone and is beginning to form a higher low structure, a classic early signal of trend reversal. If the market maintains its current trajectory and breaks through overhead resistance, the next leg could push prices into higher zones very quickly, making it a compelling setup for swing and position traders alike. The confluence of good volume, strong fundamentals, and favorable price structure paints an optimistic outlook for FIDAUSDT.
✅ Show your support by hitting the like button and
✅ Leaving a comment below! (What is You opinion about this Coin)
Your feedback and engagement keep me inspired to share more insightful market analysis with you!
FIDAUSDT trade ideas

Bonfida —Solana Name Service Strong 900% Target MappedI have another one for you and this one we've been looking at for some time. Bonfida —Solana Name Service (FIDAUSDT).
This is a good project, based on the chart. The December 2024 high was set at 0.4277. This is a "mandatory" target, that is, an easy hit or must hit because the market tends to challenge resistance just as it challenges support.
On the down-wave the last low was broken completely, then sideways a little bit and now comes the change of trend. On the up-wave the last resistance will be challenged and broken and this is how 900% becomes possible mid-term, it will be awesome. It is not the same reading about potential profits and predictions vs experiencing the results. Imagine how nice you will be feeling when your money grows but for this to be possible now you must buy and hold.
I expect higher prices of course and this will be confirmed soon enough, for now, the targets on the chart are more than ok. We are not greedy, to be honest, we are happy with 200%, 300%. But, knowing how strong Cryptocurrencies potential is, we aim higher but always securing profits.
Make a habit of securing profits on the way up. If you can accumulate many small wins, eventually you will reach the big ones. Start small and grow big. That's one way, or simply wait for the top. Regardless of your choice, you will be successful in this cycle; we have the right experience, we have the right guidance, we have what it takes.
I am happy to have your support. Thank you for reading again.
Namaste.

Solana Name Service—Bonfida, Bull Market Volume (2,450% PP)Sometimes just one signal is enough. We have a clear bottom pattern and the highest volume ever. The interesting part is that trading volume started to rise significantly in September 2024, a long time ago. There is lots of interest for this pair.
Solana Name Service—Bonfida—FIDAUSDT is still early, not bullish confirmed.
There is a low in April, then in May and again in June. This chart pattern reveals a bottom. Coupled with the highest volume ever for two consecutive weeks, and you know a strong support level has been established.
Not many people will be able to catch (grab) this bottom. Many people are even allergic to such a strong opportunity. We tend to feel repelled by the market and turn away when prices are low. Only when there is action, strong bullish action and prices are high our interest is piqued.
Ok, things are different today. We are going to fight this force that tells us to move on, and we are going to consider an easy spot trade. We are going to buy and hold. What can go wrong buying LONG when the market hits bottom? Nothing. The worst case scenario is a long-term wait. On the other hand, if the altcoins market turns bullish tomorrow, we can profit from the entire bullish wave. Months and months and months of rising prices. Whenever there is a correction, we don't have to worry our entry is the best possible.
The best possible ever is now for this pair.
FIDAUSDT is set to grow. Bitcoin and the altcoins market will follow. Everything will grow... Just watch!
Thanks a lot for your continued support.
Namaste.

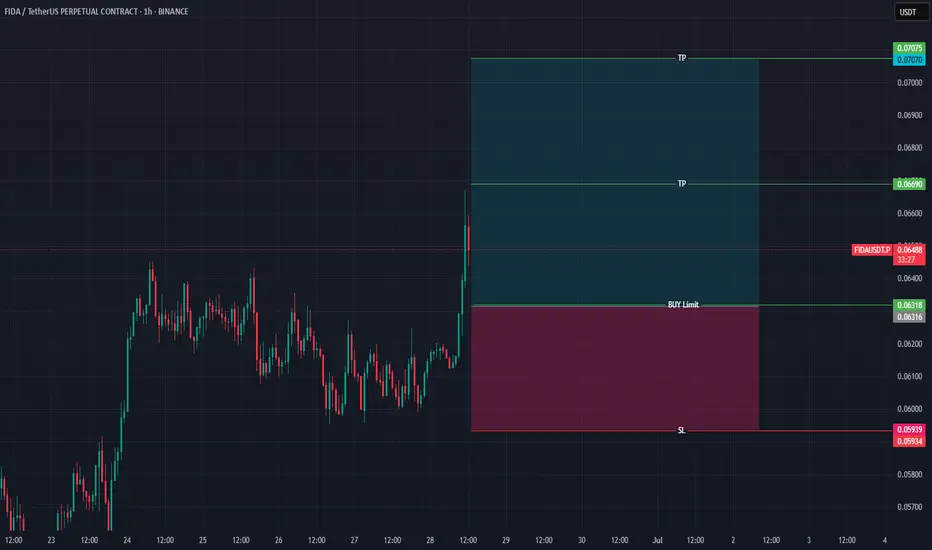
Bonfida – The Sleeping Giant. A 1:17 Risk-Reward Setup!Current Situation:
Bonfida (FIDA) is showing signs of forming a long-term bullish trend after a correction. The price is holding above key support levels, and trading volume is increasing amid a broader crypto market recovery.
Trade Parameters:
Entry Price: $0.0660
Stop Loss: $0.0550 (~16.6% risk)
First Take-Profit (TP1): $0.25 (~+279%)
Second Take-Profit (TP2): $2.00 (~+2930%)
Rationale:
Technical Analysis:
$0.066 – Accumulation zone after the correction.
$0.055 – Strong support (former resistance, D1 EMA200).
$0.25 – Key resistance level (previous highs after correction).
$2.00 – Long-term target upon breakout above $0.25.
Fundamental Drivers:
Bonfida is a native token in the Solana ecosystem (decentralized domains, trading tools).
Growing interest in Solana could push FIDA to new highs.
Risk Management:
Risk per trade: No more than 1-2% of capital.
Trailing stop: After reaching $0.25, move stop to breakeven or $0.15.
Partial exit: Close 30-50% at TP1, hold the rest for $2.00.
Conclusion:
This trade offers high upside potential with controlled risk. $0.066 is an optimal entry, with $0.055 as protection. First target $0.25, followed by a massive rally to $2.00 if Bitcoin halving and a bull market align.
🚀 Dynamic stops and risk control = key to success!

FIDAUSDT 1D Analysis FIDA ~ 1D Analysis
#FIDA Buy incrementally on retesting this support block with a short term target of at least 10%+ from here.

FIDAUSDT 1D#FIDA has formed a descending broadening wedge on the daily chart. It is currently facing resistance at the daily MA100. In case of a breakout above the pattern resistance and the MA100, the targets are:
🎯 $0.1160
🎯 $0.1436
🎯 $0.1979
🎯 $0.2418
⚠️ Use a tight stop-loss.

FIDAUSDT UPDATEFIDAUSDT is a cryptocurrency trading at $0.1094. Its target price is $0.2400, indicating a potential 100%+ gain. The pattern is a Bullish Falling Wedge, a reversal pattern signaling a trend change. This pattern suggests the downward trend may be ending. A breakout from the wedge could lead to a strong upward move. The Bullish Falling Wedge is a positive signal, indicating a potential price surge. Investors are optimistic about FIDAUSDT's future performance. The current price may be a buying opportunity. Reaching the target price would result in significant returns. FIDAUSDT is poised for a potential breakout and substantial gains.

$FIDA - Upside starts hereBINANCE:FIDAUSDT - Ready to rock and roll is what FIDA is going to do. Entering a bullish zone.

Hype or Game-Changer?SNS says they will announce something, likely around February 18th.
I don’t know what it is, but if it's worth speculating on, it could be a name change or a major partnership.
Crypto hasn’t followed traditional analysis patterns over the past two years—it’s mostly driven by speculation, news, and hype.
Looking at it from this perspective, and considering the rising volume, the coin could reach $1 in the coming days before dropping to the $0.20 range ahead of the announcement.
We’ll see if "changing skins" is worth it or not later on.
If it’s a major partnership with a strong use case, investors usually get excited for a new ATH.
If it’s just a name change, investors might see it as a sign that it's been dormant for years and now is its time.
If you’re already in, it’s your play.
If you’re new, make sure to do your own research before jumping in.

Bonfida Going Bullish —Entering Long-Term Growth PhaseNotice the same pattern, the ending diagonal, that is present on the API3USDT trading pair. This means that FIDAUSDT is already ready to grow.
The exact same dynamics. A low 3rd-February followed by some sideways. This sideways will lead to a strong bullish breakout which means up, and then more up.
This bullish breakout will only signal the start of a major bullish wave and bullish trend. Higher highs and higher lows.
—You can choose to get in at support (now) and sell when the first target hits (resistance) and then rush to find a new pair.
—You can also choose to buy and hold long-term. This removes complexity and can result in almost zero to no mistakes.
The first method requires more experience and a stable mind.
The second can be applied by anyone as it requires no knowledge just trust.
If you trust what I write, you will proceed to buy and hold.
Sell when prices are up.
Patience is key.
Choosing is only the second step. The first step is to read.
Read, read, read. Read everything I share every single day.
As you read daily, you will get a feeling of the market, you will understand everything that I am sharing and what you need to do will become obvious. If you have doubts, take your time because opportunities are endless, the market is not going away.
Thank you for reading.
You are appreciated.
Namaste.

FIDA good entry point to get up to 2400% Fida is a name service on Solana. I waited 14 cents for more than a year and finally my orders got filled.
It could possible got a bit lower but i already have filled my orders as planned.
As for now FIDA retested october 2023 lows creating double bottom for this token. Also you can see a bullish RSI divergence on 1-Month timeframe.
Main targets for FIDA is located at february 2022 levels between 3.3$ and 3.6$
Two weeks ago I saw some big players were buying 360k 300k 200k FIDA in one single limit orders so they (whales) are prepared too.
I think whole route to 3+$ will take approx. 3-4 months.

Get Played?This coin is really frustrating. It keeps repeating the same pattern in a triangle, and I keep seeing a reversal head and shoulders.
There are plenty of buyers, but the whales keep selling on purpose. If they just let it move, I’m sure it could do well.
Otherwise, it’ll probably get delisted.
It’s not even about the project or the free market anymore—I really think the whales are controlling it, not the buyers.
What do you think?

Bonfida (FIDA)Bonfida (FIDA) Bonfida is a Solana-based project that provides a suite of tools and services for the Solana ecosystem, including decentralized exchange (DEX), analytics, and domain services. The FIDA token is used for governance, staking, and fee discounts within the Bonfida ecosystem.

Unlocking Gann’s Magic: Key Levels and Scenarios on FIDA/USDTHi Traders! 👋
Let me walk you through an exciting analysis using Gann levels on the FIDA/USDT daily chart. If you’re not familiar with Gann, it’s a method that combines price and time to identify critical turning points. This chart is built on Gann’s geometric principles, plotting angles and levels to forecast potential moves.
Let’s dive into the bullish and bearish scenarios based on this chart. 🧐
Bullish Scenario:
Key Support: The price must hold above the current level of $0.2339.
Next Bullish Target Levels:
$0.252506 (630°): This is the immediate resistance. If the price breaks this level, momentum can push higher.
$0.304766 (540°): A critical target where the price may face strong selling pressure.
$0.362471 (450°): A breakout beyond this could trigger further upside, signaling a continuation of the bullish trend.
$0.425177 (360°): A significant level, marking a potential top in the short term.
If the price successfully closes above $0.425177, the next targets could align with $0.492883 (270°) and $0.565588 (180°).
Bearish Scenario:
Immediate Resistance: The current price is near $0.2339, and any failure to sustain above this level could signal weakness.
Bearish Targets:
$0.204354 (720°): If the price dips below this level, it suggests increasing bearish pressure.
$0.161649 (810°): This is a strong support zone where bulls may try to defend.
$0.123943 (900°): A break below this would confirm a deeper bearish trend.
$0.091238 (990°): A significant support level to watch out for.
$0.063532 (1080°): The ultimate bearish target in case of a prolonged downtrend.
Key Notes for Interpretation:
These Gann levels act as potential support and resistance zones, which may guide the price movements.
In a bullish trend, the price should respect higher Gann angles and consistently break resistance levels.
In a bearish trend, breaking below support levels could lead to further downside, aligning with the Gann methodology.
Wish you best of luck trading.

FIDAUSDT 1WFIDA ~ 1W
#FIDA This trade is very high risk. But if you still have Conviction on the coin,. This support block would be a very good buying place for now,. with minimal targets 20%++

FIDA NosediveFIDA is bearish at the moment. It needs to come out of the range zone to make the decisive moves.

FIDA for 2xVery nice chart. After accumulation we have new 2W candle and it does looks very good for more upside. There is a huge interest now. Playing spot trade. Swing one.
THIS IS NOT A FINANCIAL ADVICE
MANAGE YOUR RISK AND USE STOPLOSS

FIDA Bullish Analysis: New Price Targets After Breaking Support
$FIDA/USDT is rebounding from a strong support zone at $0.1850 and is currently showing bullish momentum at $0.2813, up 16.63%. The next targets are $0.4627, $0.6386, and $0.8049 if the momentum continues. Buying is recommended upon breaking the first resistance or retesting the support, with a stop-loss below $0.1850.

FIDAUSDTFIDA ~ 1W
#FIDA So far it continues to maintain this support block,. If you have Conviction on this coin,. This support block would be a very good buy for now,. buy in stages with a minimum target of 20%++


Buy Trade Strategy for FIDA: Exploring Growth in Decentralized
Descrizione:
This trading idea focuses on FIDA, the native token of Bonfida, a decentralized trading platform built on the Solana blockchain. FIDA has positioned itself as a key player in the growing decentralized finance (DeFi) space by offering a suite of tools for traders, including order book systems, API services, and decentralized exchanges. With Solana’s high-speed network and Bonfida’s focus on delivering innovative trading solutions, FIDA has the potential to benefit from the expanding DeFi ecosystem. Fundamental factors such as increasing platform usage, strategic partnerships, and continued product development make FIDA an attractive prospect for investors interested in the future of decentralized trading.
However, the cryptocurrency market is inherently volatile and can be influenced by a wide range of external factors, including regulatory developments, technological changes, and macroeconomic conditions. It’s important to trade cautiously and be aware of the risks.
Disclaimer:
This trading idea is intended for educational purposes only and does not constitute financial advice. Trading and investing in cryptocurrencies are speculative activities and involve a high level of risk, including the potential for total loss of funds. Always conduct thorough research, consider your financial circumstances, and consult with a financial advisor before making investment decisions. Past performance is not a guarantee of future outcomes.

FIDA USDT- MUST WATCHThe breakout of the trendline will decide the direction, And RSI is in 50 region and it also a resistance level.
