FILUSD WILL IT HIT 20X Sources Say YesBut listen Up Time is running out May 11th is not far away. And you will definatally want to be on top of this one asap. All jokes aside this may be your biggest money maker for 2022. These are the opportunities many wait for and never find or never see the opportunity until it is too late, and they miss out. Please remember what I am saying here because when we look back, I want you to Rember me for next time I post on a coin, and you say to yourself that guy was right last time, and I missed out once again. Don`t be that person.
Happy Trading
See You Soon
FILUSD trade ideas

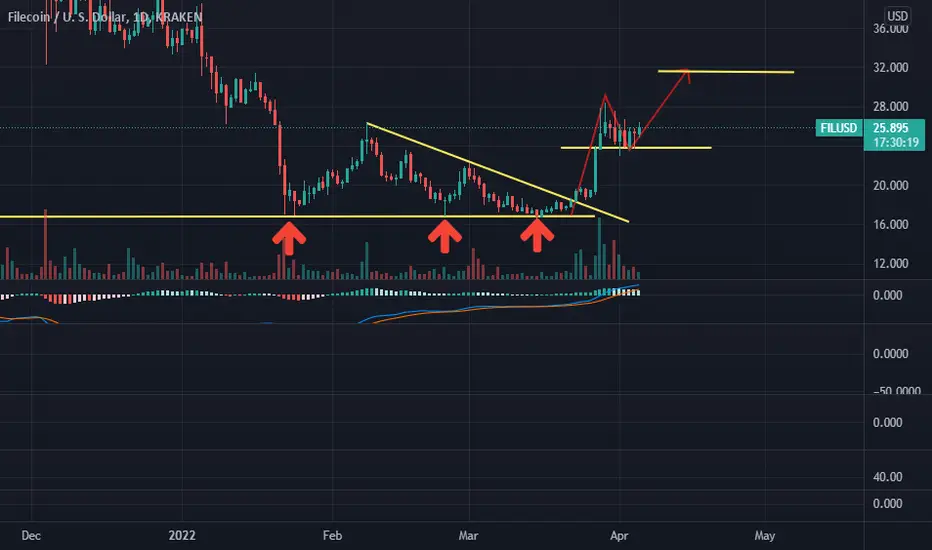
Make-or-brake Situation for Filecoin Filecoin Price got trapped inside a descending triangle pattern over the daily chart. FIL Coin falters at the verge of descending triangle pattern and tries to sustain.
The token is waiting for bulls to take charge from here for the successful bullish rally. Filecoin has been falling from 18th September 2021 and went into a descending triangle pattern over the daily chart.
This current level could be a great entry point for FIL investors and from current level FIL may hike with a strong uptrend momentum over the daily chart. From now on FIL may witness extreme buying and can approach higher levels making higher-highs.
Technical Indicators suggest no signal at the moment for FIL coin. Relative strength Index forecast neutrality for FIL coin. However, the declining line over the indicator shows that RSI haven’t signalled any strong directional change for Filecoin yet.
MACD exhibits sideways momentum of FIL in a descending triangle pattern. The MACD line is below the signal line and approaching towards it for a positive crossover.
Technical Levels
Support Levels: $17.60 and $15.00
Resistance Levels: $20.00 and $87

FILLooking at the charts. My idea is buy price around 17.99 and first sell at 20.29 and 21.15 hope this helps someone,

FIL/USDT symmetrical triangleFIL/USDT pair is forming lower highs and higher lows following two sloping trend lines that eventually intersect. We expect that breakout can be in any direction.
To determine take profit(TP) zones we can apply the measurement rule for symmetrical triangles: compute the formation height from highest high to lowest low and add to or subtract the difference from breakout price depending on the breakout direction.
This time we have support zones near expected price goals (in an upward direction 21,7/23,5 and in a downward direction - 16.8/18,45) so we can set up our TP zones in that support/resistance zones.

File coinLooking for 18.18 but more likely to hit 18.42. watch the 4 hour chart and if you intend to invest then watch the 30 sec chart.
I watch the 30 sec, 5 min and the 4 hr. I can post my indicators if you ask and what to look for. Please use the 21,50,100,200 moving average. And if you watch the charts for hours each day you will understand better.

Filecoin bull pattern formationWith its current rise and the overall market condition i expect more to come when we breakout that structure.
-Stay safe out there, feel free to share, like and suscribe.

FILECOIN THE BEST PRICE Filecoin is a decentralized storage system that aims to “store humanity’s most important information.” The project raised $205 million in an initial coin offering (ICO) in 2017, and initially planned a launch date for mid-2019. However, the launch date for the Filecoin mainnet was pushed back until block 148,888, which is expected in mid-October 2020.
The project was first described back in 2014 as an incentive layer for the Interplanetary File System (IPFS), a peer-to-peer storage network. Filecoin is open protocol and backed by a blockchain that records commitments made by the network’s participants, with transactions made using FIL, the blockchain’s native currency. The blockchain is based on both proof-of-replication and proof-of-spacetime.

FIL, step back and rebound.The following are machine translations:
The heavy volume broke through the resistance.
After the breakout, it stepped back near the previous resistance.
Rebounded near resistance.
Continue to be bullish with target around 31.
FIL - LongFIL is waking up to make HUGE move....
Buy Low - Sell High.
Like this idea ?
Please do a thumbs-ups....Thanks for watching.

FILUSD - 1D - Perfect Entry Right Now - Wyckoff AccumulationCOINBASE:FILUSD
I am still extremely bullish on Filecoin. It has held to Wyckoff Accumulations/Distributions in the past, so we can be fairly certain that it is likely to happen again.
We are finishing the spring formation now. This is THE BEST time to get in. "Why", you ask? I'm glad you asked. Because our risk:reward ratio is never better than in a spring. Go long at this point, and then set a stop loss below the lowest low point of the spring. Even if the trade turns against you then you're stopped out at nearly nothing of a loss.
You can see my projected dates and profits at the right side of the chart. If you buy and hold I do see the possibility of a ~400% profit. It could take much longer than this, but either way... we are headed there.
FIL has been accumulating/consolidating for almost 200 days. For a crypto, this is unheard of. I have a feeling it will explode within the next 7 days.

FILUSDT - Long PositionResistance about 24.64 is broken out in Daily timeframe 4 days ago and its pulled back to that resistance is done.
I thinks it is a good position for Long.
Entry price: 25.3
TP: 40.8 (61.2%)
SL: 22.8 (9.9%
R/R : 6.2
P.S: I'm not a native English speaker but tradingview is forcing me to write the caption in English. 😅


FILUSD-W-ANALYSISThis analysis is only to show the important areas. I hope you use it in your reviews.


FIL time to shine?To start, regarding my last MANA post, all is still in tact, it's just taking longer to perform than some other tokens. This is why it's best to have a few tokens in your bag. While MANA and FIL have been languishing I had a great trade with ETC, added 33% to my entire portfolio value in a week with that one trade (not pennies by any means). As MANA and FIL sat I kept rolling into ETC, as ETC topped, started rolling back into FIL as the strength was showing, letting my MANA bag ride and will add on breakout, which has yet to happen.
As for FIL, it's all in the chart. My near-term target (1-2 weeks) is $60. Good luck!

FILUSD one of strong web3 projectsThis is among the strongest web3 projects to watch this year,something might happen to them

FIL, start rising.The following are machine translations:
3 dips near 17.
The short-term downtrend and the lower 17 support form a bottom triangle.
The current breakout of the bottom triangle is bullish.
Try to place more orders and buy bottoms. The maximum stop loss is the stop loss that falls below the lowest point below.

FIL BUY opportunity with over 10% gain detected 🚀Concervative TP target: $18.86
I'm seeing a similar momentum shift taking place on MDT and FIL coins. They both have been lagging behind BTC and ETH. With the high momentum and energy build up. I expect FIL to pop higher and reach the target.
If you have enjoyed my highly accurate and high probability ideas over the last couple of days, please like, follow, comment, and tell your friends and family. I make daily posts, so don't miss out on the next trade. Let's make some money while the crypto market is still hot.
Please keep in mind that I'm not a financial advisor. Trade at your own risk.

FIL/USDTFilecoin is in the worst possible condition and has dropped in the worst possible way.
But it can trade well, and if it can pull back from the first level of support I have outlined in the chart, it can start to grow well. Otherwise, we might fall to $ 10 or even $ 5.

Filecoin LongFilecoin is severely oversold, especially when considering their progress developing the network and its relationships. Technicals suggest that price action may go lower however at the current level it's a solid place to take a long position. FIL price has formed a double bottom at $16.75 and $17.10. It may retest again to create a triple bottom which would further confirm a position in this zone. Cross section resistance coinciding with 0.236 Fib resistance places the primary target in the $60-82 range. A position here to the primary target is a >3:1 reward:risk ratio. Prior volatility suggests parabolic moves up can be sudden and the throwbacks significant... as much as 30-40% from the initial surge. The resistance zone around the daily 200MA may be a good place to play the throwback and increase holdings by 15-25% before closing at the targets above.
If price drops below the Fib baseline ($16.75), stoploss out (and be sure to reenter if price reverses and heads above). Price should stabilize in the $12-15 range if Fib baseline doesn't hold.
FIL/BTC chart to follow.

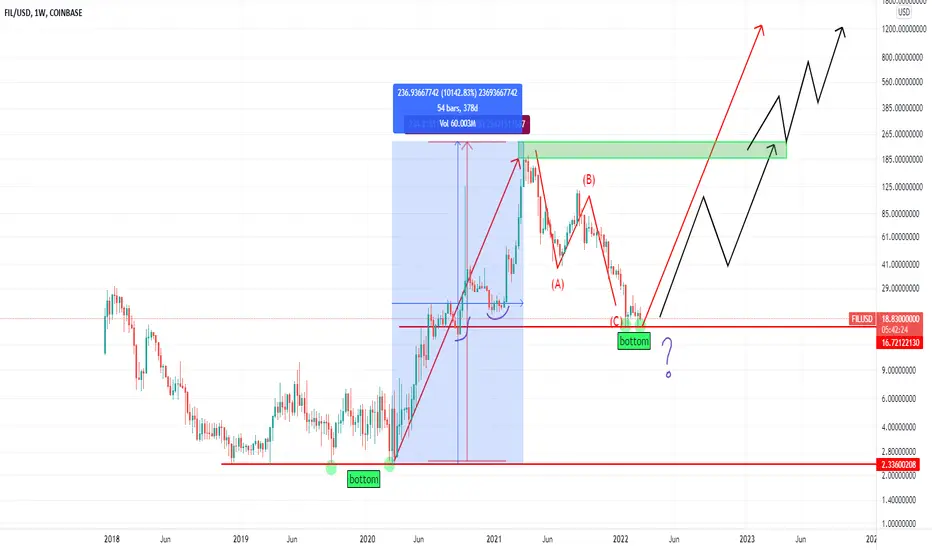
filecoin ready for pump?after a x95 run there was a big abc correction in filecoin.
2 dollars turned in 234 dollar in just 1 jear.
double bottom
resistance at ath expected, break out leads us to 1000 dollar prices
FILUSDTFIL / USDT Currency Analysis
Hi, the coin's currency code is in the fifth wave of its Correctional C wave, and we expect it to reach a return limit of $ 13 to $ 14. In this area, we will look for return patterns as well as divergence in the RSI.
