Filecoin Hits Bottom · 3 Years Long BD · Volume Signal · MACD &I think what is really nice about MEXC is that it truly reveals the bottom through volume. The changes in trading volume in this exchange are so pronounced that you can never go wrong. Look at Filecoin, extremely high volume in November 2024, right before a bullish wave. Then again, incredibly high volume last week, July 2025, right before a... Right before a major, major bullish wave, or else trading volume wouldn't be so high. It is this high because whales are buying with margin on this exchange.
Ok. A classic signal, 100% original. MA200 starts curving down strong; prices start to move up to meet this indicator, there will be a cross. So when MA200 starts diving deep down coming from a high point, the low is in, the bottom is in and the trend is about to change from bearish to bullish. Filecoin is about to start growing.
These are two signals, both very strong. Let's add another one. Bullish divergence with the MACD and RSI. Weekly, long-term. This makes these signals very, very strong.
FILUSDT weekly RSI hit bottom June 2022, in June 2025 (three years later) it produced a higher low.
FILUSDT weekly produced a major low December 2022, in June 2025 it produced a lower low. That's a strong divergence.
FILUSDT weekly MACD hit bottom February 2022. There is a extreme higher low in 2025 and also a bullish cross.
Needless to say, the bullish cross indicates the market is about to change. This matches the volume signal, the MA200 signal, marketwide action, the bullish divergence with the RSI, Ethereum and the rest.
Everything is bullish if you look deep enough. Bullish means potential for growth when prices are low. Bullish potential. That's what we are looking for. Filecoin is about to turn-up.
Namaste.
FILUSDT trade ideas
Filecoin (FIL): Easiest Prediction So Far | Risk:Reward 1:7 Our entry got triggered from last time when we were looking for the last liquidity sweep, which indicated that upcoming bullish movement might follow up, and that's exactly what has happened so far.
Buyers are dominating, and we are seeing good chances for our target to be filled; it is just a repeat of history...
Swallow Academy

Filecoin FIL price analysis🪙 It would seem that #Filecoin is a “dinosaur” of the crypto market, having survived so many different cycles and “shocks,” whose fundamentals should only increase the annual application of the project, but no... it's not happening...
Looking at the OKX:FILUSDT chart, we see that the accumulation phase in the $2-11.50 range has been going on for over 1150 days, which means that another +/- 30-60 days of correction will not make a significant difference.
What can we say: we wish the holders patience and hope they wait for their moment of glory together with #FIL
🙂 And for those who want to test their luck and try to jump on the “last train” — place a “bucket” at $1.80 (any lower than that would be indecent)
Of course, if you believe that the price of #FILUSD will still be able to grow to at least $4.50 this year, and ideally to $11.50.
_____________________
Did you like our analysis? Leave a comment, like, and follow to get more

FILUSDT_1D_BuyFILUSDT Cryptocurrency Analysis Daily Medium and Long Term Time Frame Main Support 2.320 Targets 3.486 and 5.948

FIL Secondary trend. Channel zone. 31 03 2025Logarithm. Time frame 3 days (less is not needed).
Main trend. Time frame 1 week.
Published more than 2 years ago 22 01 2023
FIL/USD Main trend. From the maximum of $237 -99%
In the specified range, a horizontal channel with a large % step (exactly 370%) was formed earlier (2.590 - 7.157/10.7). There have already been 3 pumping waves in this channel. From the pumping highs in the main trend, the price fell by -98.98%
Secondary trend . This horizontal channel with a step of 370% and work with trend reversal formations.
Local trend , zone of formation of a descending wedge, zone of capitulation and trend reversal.
FIL/USDT Local trend. Wedge. Price clamping . 30 06 2024
Working now with the forming descending wedge and trend reversal in case of its breakthrough.


Bullish Sign FIL / USDTBreak and retest high and make a new higher low also there is a fake breakout on Weekly
Target : 3
Stop : 2.36

FILUSDT trading ideaFILUSDT broke down from a bearish formation and has since been trading within a descending channel, carving out what appears to be a 3-wave corrective structure (ABC) to complete wave W of a broader corrective pattern.
Price is now approaching a critical zone where wave X is expected to develop. If price manages to break above the projected sell-off zone, bullish momentum could reclaim control, opening the path toward the next major target at $18.308.
However, a rejection at this key resistance would likely trigger another downward leg, pushing the price back into the immediate demand zone. A failure to hold this support would significantly increase the risk of a deeper breakdown toward the projected wave Y target around $0.995, completing the extensive correction structure.
This is a pivotal moment for FILUSDT, We should closely monitor price action around the sell-off zone for clues on whether bulls can reclaim dominance or if the correction will deepen further.

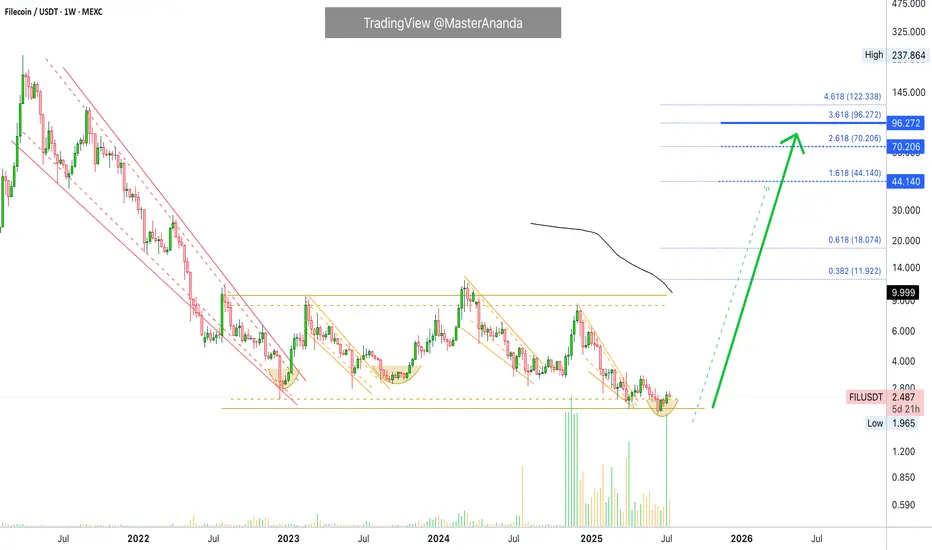
FIL/USDT – Potential Breakout SetupFilecoin is currently forming a classic falling wedge pattern on the daily chart, signaling a potential bullish breakout. A successful breakout and hold above the wedge resistance could initiate a strong upward move.
Key upside targets to watch
$3.41
$4.39
$5.43
$6.27
$7.14
$8.42 🪽
This setup offers a favorable riskreward opportunity if confirmed by volume and price action. Monitor closely.

Filecoin to $2,100 Per ShareThis is Not Financial Advice.
I oftentimes have crazy speculative publications about charts. I don't know anything.
I want this to be published in the paint on the offchance that we do-do this style of bullmarket.
It will be good to see Filecoin out the basement!
I am always stacking Filecoin shares on spot and have been doing so for years.
Let's see how it plays out. I just drew this with my human hands in one swoop with my guts as a guide. It should work out perfectly.
Enjoy and Happy Trading,
Mr. Storm

FILUSDT 1D#FIL has been accumulating inside a descending channel for a long time, and the chart now looks very promising.
Both RSI and MACD are signaling the beginning of a potential bullish move.
If a breakout occurs above the channel resistance and the daily EMA50, the upside targets are:
🎯 $2.859
🎯 $3.408
🎯 $4.301
🎯 $5.024
🎯 $5.746
⚠️ As always, use a tight stop-loss and apply proper risk management.

Map Of FillIt has been moving sideways for more than two years and a head and shoulders pattern has been formed on a large monthly fact first glance at the chart, we find that it has been moving sideways for more than two years, forming a head and shoulders pattern, which indicates a further decline. On the other hand, a sideways wave has been formed, which is an X wave, and we are preparing for a large bearish W wave to come.rame, so it is expected to fall again strongly to one of the two areas specified below.
Note: There is a previous analysis of this currency on my page and all its legacies were explained before.
*In principle, I am not a supporter of any direction, but I am only giving my point of view, which may be right or wrong. If the analysis helps you, then this is for you. If you do not like this analysis, there is no problem. Just ignore it. My goal is to spread the benefit. I am not one of the founders of the currency.

A scalping study using volume and Elliott Wave theory.A study I conducted to show how to make money in scalping by applying simple Elliott Wave analysis and volume control.
Attention: There’s no audio, and when examined carefully, none is needed.

FILUSDTCryptocurrency Futures Market Disclaimer 🚨🚨🚨
Trading cryptocurrency futures involves high risks and is not suitable for all investors.
Cryptocurrency prices are highly volatile, which can lead to significant gains or losses in a short period.
Before engaging in crypto futures trading, consider your risk tolerance, experience, and financial situation.
Risk of Loss: You may lose more than your initial capital due to the leveraged nature of futures. You are fully responsible for any losses incurred.
Market Volatility: Crypto prices can fluctuate significantly due to factors such as market sentiment, regulations, or unforeseen events.
Leverage Risk: The use of leverage can amplify profits but also increases the risk of total loss.
Regulatory Uncertainty: Regulations related to cryptocurrencies vary by jurisdiction and may change, affecting the value or legality of trading.
Technical Risks: Platform disruptions, hacking, or technical issues may result in losses.
This information is not financial, investment, or trading advice. Consult a professional financial advisor before making decisions. We are not liable for any losses or damages arising from cryptocurrency futures trading.
Note: Ensure compliance with local regulations regarding cryptocurrency trading in your region.
thanks for like and follow @ydnldn
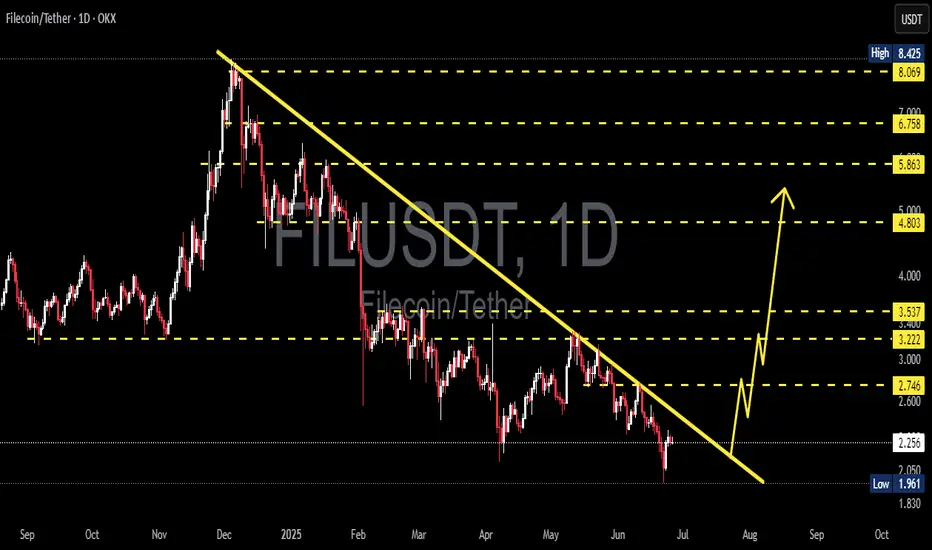
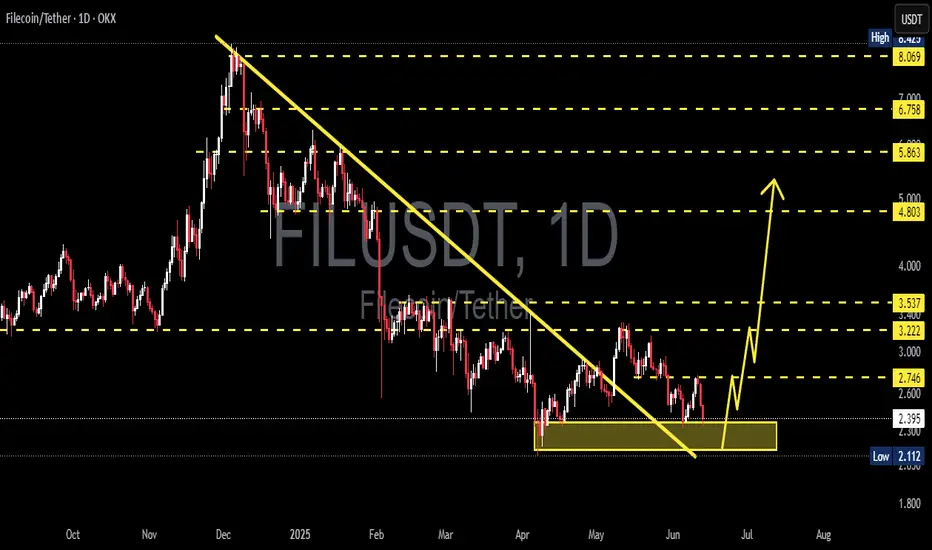
FIL/USDT – Major Trendline Breakout Imminent?The FIL/USDT chart is showcasing a significant descending trendline that has been respected since its peak in late December 2024. Price action has recently approached this trendline again, and a potential breakout scenario is forming. This setup may signal a major shift in trend after months of persistent decline.
🔍 Technical Analysis:
Trendline Resistance:
The long-term descending yellow trendline has capped every bullish rally since early 2025. A breakout above this trendline would be a major bullish technical signal.
Support Level:
Key horizontal support has been held at around $1.96, which has formed a strong base.
Potential Breakout Projection:
Upon breakout, $2.746 is the first resistance to watch.
A successful retest of this level could lead to a stair-step rally targeting:
$3.222
$3.537
$4.803
$5.863
$6.758
And potentially $8.069–$8.425 if momentum continues.
Bullish Pattern:
The projected move shows a potential impulse wave pattern following the breakout, indicating staged profit-taking zones for traders.
🧠 Strategic Consideration:
A daily candle close above the trendline with volume confirmation would be the first sign of trend reversal.
Conservative traders may wait for a retest of the trendline as support before entering.
Targets can be approached progressively based on price action near each resistance level.
⚠️ Risk Management:
Watch for fakeouts near the trendline.
A break below the key support of $1.96 would invalidate the bullish thesis.
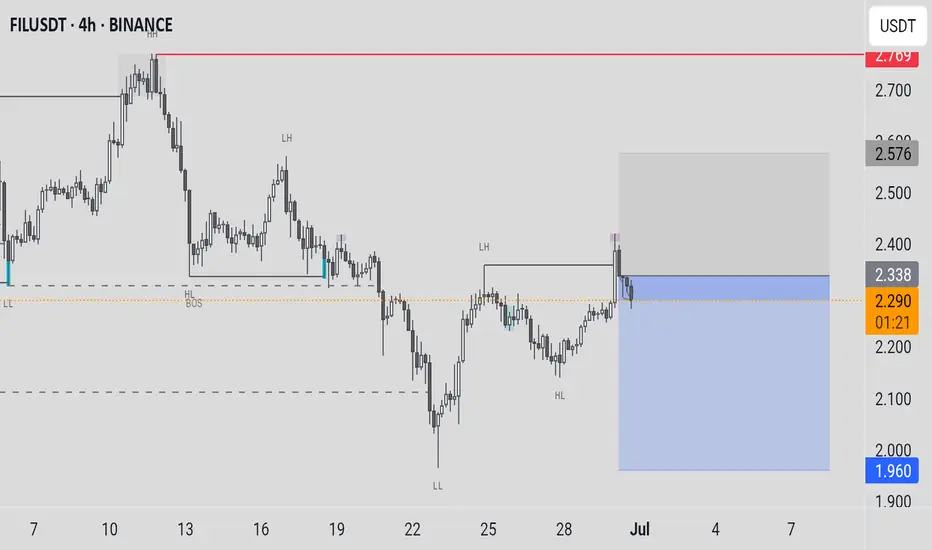
FILUSDT - short-term rally is upon ushi traders,
FILUSDT looks good for a short-term rally.
The regular bullish divergence formed.
Risk-Reward ratio: 6,67
Target: 2,74$
It may be a quick move.
I expect it to happen within the next 7 days.
Good luck

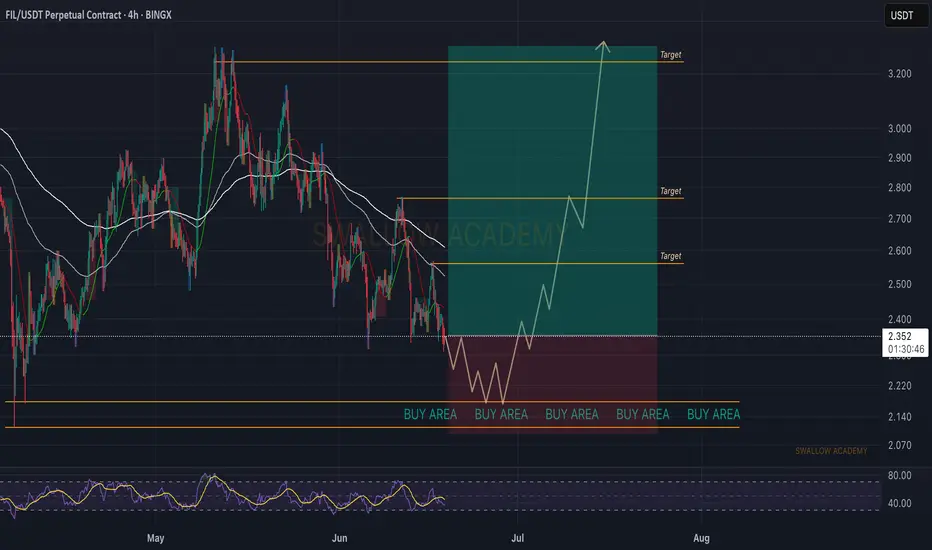
Filecoin (FIL): Possible Further Push From Here Towards $3.20Filecoin is following an interesting pattern of uptrend here where we had a nice upward movement, which then was followed by a correctional movement and another wave of upward movement.
Recently we had another breakdown where now we expect to see another BOS, which would lead to further movement to upper zones so let's wait out and see if it plays out as we see it.
Swallow Academy

Filecoin (FIL): Approaching Support Area | Good Buy OpportunityFilecoin is approaching a local supprot area or more of a liquidity area, where we have seen liquidity sweeps before bigger upward movement (and that's mainly because this is the local bottom).
So we are looking for upward movement from here, similar to all the previous times.
Swallow Academy
FILUSDT 1D AnalysisFIL ~ 1D Analysis
#FIL This is the lowest support for now. Buy if you still have confidence in this coin with a short term target of at least 20%+ from this support.
Filecoin Wave Analysis – 10 June 2025
- Filecoin reversed from strong support level 2.25
- Likely to rise to resistance level 2.875
Filecoin cryptocurrency recently reversed up from the strong support level 2.25 (which has been reversing the price from the start of April).
The support level 2.25 was further strengthened by the lower daily Bollinger Band and by the support trendline of the daily down channel from the middle of May.
Filecoin cryptocurrency can be expected to rise to the next resistance level 2.875 (top of the minor correction ii from the end of May).

FIL Testing Critical Descending Channel Support on Daily ChartLSE:FIL is currently finding support at the key descending channel on the daily timeframe 📉.
This level acts as a pivotal point where momentum could quickly build if buyers defend it strongly ⚡️.
Watch closely for a bounce or a breakdown — either move will set the tone for the next trend shift 👀.
Stay prepared and monitor price action for timely opportunities!

Spot signalHello friends
As the price reaches the specified support level and buyers enter, you can see that higher ceilings have formed and you can take advantage of this opportunity and now buy with capital and risk management and move towards the specified goals.
*Trade safely with us*

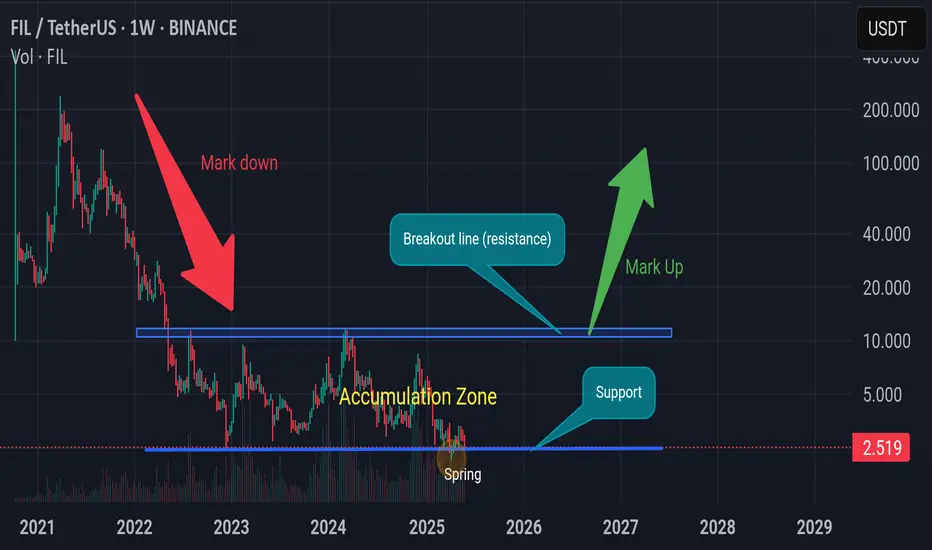
FIL !! Bullish scenarioFIL bullish scenario (wyckoff accumulation).
⚠️Invalid if break down the support line