Filecoin Wave Analysis – 10 June 2025
- Filecoin reversed from strong support level 2.25
- Likely to rise to resistance level 2.875
Filecoin cryptocurrency recently reversed up from the strong support level 2.25 (which has been reversing the price from the start of April).
The support level 2.25 was further strengthened by the lower daily Bollinger Band and by the support trendline of the daily down channel from the middle of May.
Filecoin cryptocurrency can be expected to rise to the next resistance level 2.875 (top of the minor correction ii from the end of May).
FILUSDT trade ideas

FIL Testing Critical Descending Channel Support on Daily ChartLSE:FIL is currently finding support at the key descending channel on the daily timeframe 📉.
This level acts as a pivotal point where momentum could quickly build if buyers defend it strongly ⚡️.
Watch closely for a bounce or a breakdown — either move will set the tone for the next trend shift 👀.
Stay prepared and monitor price action for timely opportunities!

Spot signalHello friends
As the price reaches the specified support level and buyers enter, you can see that higher ceilings have formed and you can take advantage of this opportunity and now buy with capital and risk management and move towards the specified goals.
*Trade safely with us*

FIL !! Bullish scenarioFIL bullish scenario (wyckoff accumulation).
⚠️Invalid if break down the support line
$FIL sell side liquidity swept, the only way is up !LSE:FIL has been in a sideways consolidation range for a good period of time now. While I still struggle to see this coin re-visiting all time highs due to fairly heavy dilution, this trade opportunity looks too good to pass up on!
💰 We can see the clear range, which has recently seen a liquidity sweep of the previous lows.
💰 Price has managed to reclaim the level so far, and is now using it as support.
To me, it looks like price will progress from this level back up to the top of the range.
Good luck traders !
Kieza Tradez

Is a miracle going to happen?!The bulls have a tough job to do to save Filecoin. But if an alt-season is to happen, it will definitely blow Filecoin's nest.

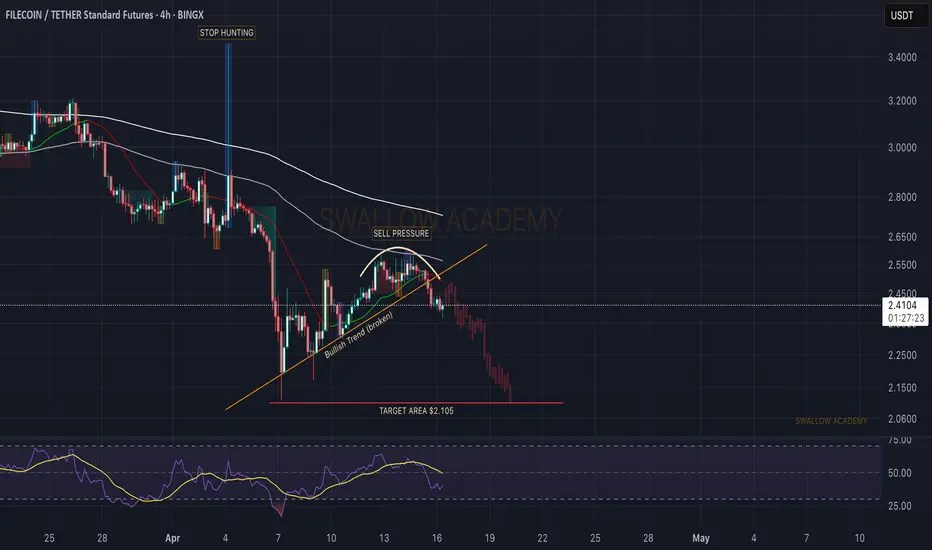
Filecoin (FIL): Break of Trend | Possible 1:2 RR TradeWe noticed a nice break of trend on Filecoin where sellers slowly took over the dominance, turning the market price over and resulting in a sweet break right there.
Now, after a recent stop hunt we had on the 4th of April, we have to be careful, as there might be similar movement happening (who knows), but overall we are aiming for that lower target zone as long as sellers maintain the dominance over the 100EMA line.
Swallow Academy
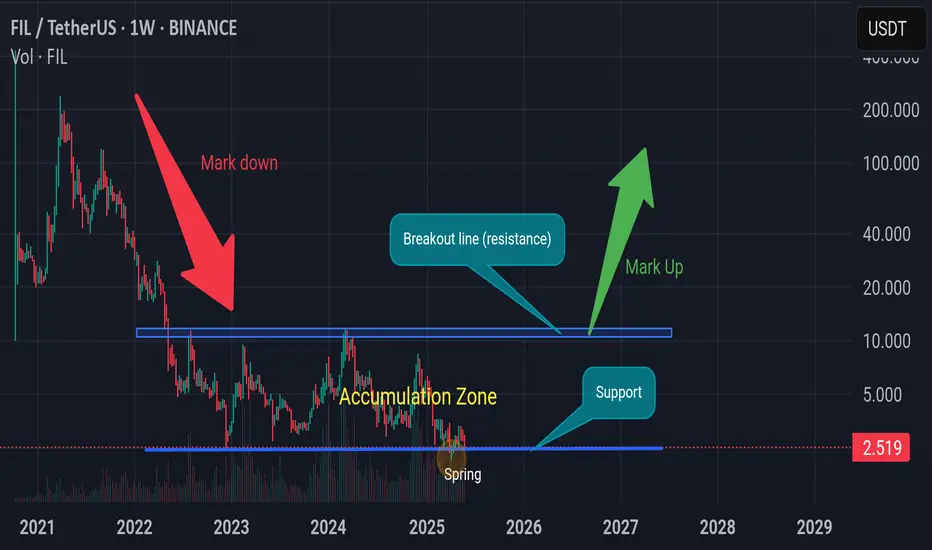
FILUSDT — the formation is repeating, the structure is familiar.Filecoin(FIL) - is a decentralized storage system with the goal of "storing humanity's most important information." During its initial coin offering (ICO) in 2017, the project raised $205 million. The launch was initially planned for mid-2019, but the mainnet launch date was postponed until block 148,888, which occurred on October 15, 2020.
📍 CoinMarketCap : #50
📍 Twitter(X) : 667.3K
🔍 What I observe:
I’ve added the full trading history to the chart for better understanding (the chart on exchanges is cut off). The coin is liquid. I also added the prices for the public and private offerings.
There’s a large horizontal channel, or more specifically, a channel within a channel, which has been active for about 1111 days.
After another drop, a descending wedge formed, and now we are witnessing a breakout of its resistance (a retest is possible).
These patterns are ones I regularly track and trade, based on personal experience accumulated over the years and my strategy.
📊 I’ve plotted the nearest resistances and target prices with movement percentage calculations.
💭 It’s quite possible that this formation in the lower part of the wedge, coinciding with the area of lows on the support of the outer channel, was used to gather liquidity and shake out weak hands.
I also want to point out the large wicks in this zone - a characteristic pattern for accumulation points and subsequent reversals.
______
📌 Not financial advice. Observing structure and recurring phases.
Operate within your strategy and with an awareness of risks.

Filecoin long to $3.245Just now opened a long position on Filecoin. I anticipate a pump to at least $3.14 today.
Market is pushing way from the daily open and I don't think it will return or at least it think its less probable to.
Position is roughly 2rr until $3.14
I might take full profit there as its weekly resistance but depends on the momentum
Full tp at $3.245 daily HH point

FILUSDT 1D Analysis FIL ~ 1D Analysis
#FIL Buy gradually from here if you still have confidence in this coin with a short term target of at least 15%+ from here.

FILUSDT 1W AnalysisFIL ~ 1W Analysis
#FIL Buy gradually from here if you still have confidence in this coin with a short term target of at least 20%+ from here.

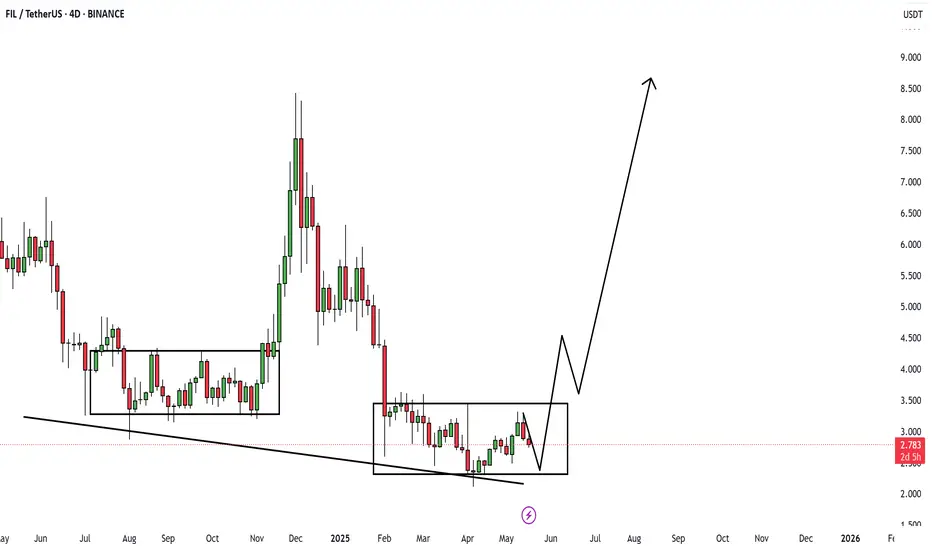
The chart for FIL/USDT on the 4-day timeframe shows a promising
📊 Technical Analysis Summary – FIL/USDT
🔸 Pattern Observed:
Double Accumulation Range: Two clear consolidation phases are boxed out in the chart, showing accumulation at relatively equal support zones.
Descending Support Line: The lower black trendline connects the major lows, creating a descending support structure, indicating compression and possible breakout setup.
🔸 Price Action:
Current Price: $2.787
Pullback Expected: A minor dip within the current range is possible before a breakout.
Projected Move: If this consolidation resolves bullishly, the projected target appears to be in the $8–$9 range, aligning with the black arrow on the chart.
📈 Bullish Scenario (Likely Path)
Retest support near $2.5–$2.6
Breakout trigger on move above ~$3.2–$3.4
Target zone = $8–$9 (from measured move potential)
⚠️ Key Levels to Watch
Support: $2.50 (critical zone for accumulation)
Resistance to break: ~$3.30–$3.50
Macro Target: $8.50+
✅ Conclusion:
This chart shows a potential reversal from a prolonged downtrend, where the price is forming a classic reversal structure. Patience is key—a breakout above $3.5 would confirm the bullish move.
FIL/USD.tWhy I love what I do and enjoy everyday of it stress free. Trading larger timeframes and understanding structure! I am not going to say much more here... you can identify the zone we at... remember accumulation with rising volume... simply put "smart money"

FIL Approaching Key Breakout Zone on Higher Timeframes🚀 LSE:FIL – Breakout Watch
📅 Daily timeframe shows FIL breaking above a descending resistance line ✅
📈 Weekly view highlights a sharp bounce off the $2.4 support after exiting an ascending channel. Now, price is pressing up against a major descending trendline.
📍 A breakout here could ignite strong bullish momentum.
👀 Eyes on FIL — this setup looks loaded for a move!

FILUSDTFIL is showing signs of a potential trend reversal 📊
Price has formed a higher low and is now approaching the key resistance at 2.485 USDT. A breakout above this level could open the way toward the next major zones around 2.887 and even 3.189 USDT 🚀
However, if rejection occurs, we might see a pullback toward the 2.272 USDT support area 🔁
Currently, momentum is leaning bullish and favoring a move higher, especially if the descending trendline gets broken with strength 💪

FIL bull-pollbakThe Filecoin ( BINANCE:FILUSDT ) chart, after a correction to $2.65, is attempting to pull back to the broken level around $2.77. If it fails to break this resistance, another decline towards support levels at $2.525 and then $2.39 is likely, which could act as a potential starting point for a new upward movement towards targets at $3.02 and $3.30.
🔑 Key Zones on the FIL Chart:
Primary Resistance: $2.77 (Pullback to broken level)
First Support: $2.525
Second Support: $2.39
First Bullish Target: $3.02
Second Bullish Target: $3.30

A basic password must be in the basket...You can buy spot here with a specified stop loss and profit limit.
Allocate 10 to 15 percent of your portfolio to this cryptocurrency, because it is good both fundamentally and technically and has a good future.
.
.
.
.
I hope you liked our team's analysis completely, follow our page to see more analysis.

#FILUSDT - bottomed out!On the weekly timeframe, the downward trendline has been broken and successfully retested.
A strong move upward is just a matter of time…
Notice how it bounces hard every time it touches the support zone marked by the grey rectangle — this has happened three times in a row.
Also, FIL has been in an accumulation phase for around 1,092 days — that’s nearly 3 years.
$28 is a target I'm fully confident in for this coin.
Best Regards Cecilion🎯

FILUSDT Potential UpsidesHey Traders, in today's trading session we are monitoring FILUSDT for a buying opportunity around 2.60 zone, FILUSDT is trading in an uptrend and currently is in a correction phase in which it is approaching the trend at 2.60 support and resistance area.
Trade safe, Joe.

filNothing is visible in this channel at the moment
We had a bottom in the green box that was broken and I marked the end of its movement with the blue line. The end of the movement that can be considered for it in the medium term is the red lines
Now, depending on the market conditions, it is up to you to decide
And if a launch is to be made, the ceiling of the channel can be available in the first step
But any step-by-step purchase with controlled volumes, I think, can be appropriate in the reversals and place your stop below the blue line

Filecoin 5X Lev. Full PREMIUM Trade-Numbers (PP: 3130%)Another day, another amazing trade.
My fellow Cryptocurrency trader, I hope you are having a wonderful day.
Timing is key. Timing is everything.
Timing and a great entry.
Let's all wait when the market advances and turns green; that's ok, we can wait.
Let's rush-in when the market turns red, that's the best time to enter such a low risk but potentially highly profitable trade.
Filecoin is one of your favorites and I am sharing a set of full trade-numbers with you today.
The numbers below are capped at $18.6, a medium sized wave. But we all know this isn't the entire bull market.
$18.6 yields 626% profits from current prices. That's a huge 3,130% with 5X.
If we consider the number on the chart, a strong target for 2025, potential can go as high as 13,165% with 5X. These are huge numbers; leveraged trading is for experts. You decide how to approach this chart, these numbers and these targets.
You deserve the best you know?
The market will give you as much as you can take and hold.
If you can handle millions, the market has millions ready for you. If you can handle thousands, the market is ready to give you as much. There is no limit truly, even the giants are trading Bitcoin with billions upon billions and making their money grow.
You want tens of millions or hundreds of millions?
The market is liquid, if you can take it it is yours.
Full trade-numbers below:
_____
LONG FILUSDT
Leverage: 5X
Entry levels:
1) $2.60
2) $2.45
3) $2.30
4) $2.12
Targets:
1) $2.70
2) $3.04
3) $3.60
4) $4.52
5) $5.26
6) $6.01
7) $7.07
8) $8.42
9) $9.91
10) $10.8
11) $12.3
12) $14.7
13) $16.4
14) $18.6
Stop-loss:
Close weekly below $2.10
Potential profits: 3130%
Capital allocation: 5%
_____
Thank you for reading.
I am rooting for your success.
I am wishing for you great profits... Can't wait for the market to take off, it is exciting, the build-up phase.
Patience is key.
Namaste.

#FIL/USDT#FIL
The price is moving within a descending channel on the 1-hour frame and is expected to break and continue upward.
We have a trend to stabilize above the 100 moving average once again.
We have a downtrend on the RSI indicator that supports the upward move with a breakout.
We have a support area at the lower limit of the channel at 2.60, which acts as strong support from which the price can rebound.
Entry price: 2.64
First target: 2.72
Second target: 2.78
Third target: 2.87
