FIO is ready for the trendLarge-cap coins showed growth yesterday following the tops, and memcoin bullying is subsiding today, followed by a high probability of bullying in the remaining altcoin market. I expect the main day of growth tomorrow until Sunday afternoon, then the probability of a major pullback prevails until the middle of the new week.
Today, fio, which I considered for work in the first place, continues to accelerate growth. The main goal is to retest the key level of 0.025, which will open the way up to 0.50-75. We can see a repeated breakdown and consolidation above today. If the second half of the month opens above the level by June, the fio may move into the range of 0.045-60. With sufficient volatility, a test of this range is likely tomorrow.
After working fio and chess up to 60-90% from current levels as the most undervalued assets in finance today, quick adx pivx can be additionally considered for scalping. There is also a high probability of a new blizzard on atm city acm fantokens with new hays.
FIOUSDT trade ideas

Fiousdt trading ideaFIOUSDT has completed a full five-wave impulse sequence, followed by a corrective ABC structure, aligning with Elliott Wave principles.
The price is now approaching the base level of wave 5, a crucial zone that could dictate the next structural move. If this level holds, the market is expected to initiate a WXY corrective pattern, as outlined in the chart.
However, a failure to maintain support at this level could extend the corrective phase, leading to another test of the descending dynamic trendline, with the critical support zone acting as the ultimate downside target.

FIO UPDATE DAILY TIMEFRAME
FIO Protocol (FIO) is a decentralized, open-source usability solution that enables easier cryptocurrency transactions on all blockchains by replacing complex wallet addresses with a single, customizable, and human-readable Crypto Handle
ANY THOUGHTS ON $FIO ?
❤️ THIS POST AND WE WILL SHARE NEXT pair

FIOUSDT CHART ANALYSİS - EDUCATİONAL POSTWhy Track Insider Trading
Insider trading is one of the least known successful stock market anomalies. It’s managed to beat the market by an average of 7 percentage points annually over the past 50 years. Several peer-reviewed academic studies covering different time periods document the profitability of insider trading. It’s profitable in the United States and in several other developed countries. Perhaps most importantly, it was possible over the past half century to beat the market by imitating insiders’ purchases.
Top officers, members of the board of directors, and 5+% shareholders are classified as insiders. Consultants, lawyers, and underwriters become insiders for short periods of time when they possess market moving information about the companies with which they are affiliated. What makes a person an insider is their possessions of market moving information and fiduciary duty to the shareholders of the company. Possession of market moving information gives insiders an edge over other investors and helps them beat the market.
Insiders also have an edge over retail investors because they usually know their businesses and their industries inside and out. They know what products they’ll be launching, strategies they’ll be pursuing, and which businesses they’ll be acquiring or divesting. Such information is generally not disclosed to the public in detail. It is illegal for insiders to trade based on material non-public information but perhaps more importantly, it is nearly impossible for prosecutors to detect and prosecute such transactions.
It’s possible for insiders to profit legally from market moving information. When they’re in possession of imminent negative non-public information they can postpone their purchases until after the disclosure and avoid losses. The absence of insider buying may be a signal for negative news in some cases. Similarly, when insiders are in possession of imminent positive news they can postpone selling their holdings and indirectly profit from inside information. Drops in insider sales may be a signal for positive news in some cases.

Fio"Analysis of FIOUSDT: Key focus on maintaining support at MA 89 and the 0.0375 zone. A false breakout above the ascending bearish channel followed by a pullback highlights the importance of confirming support before targeting higher levels."

FIO/USDT Chart Analysis FIO is trading at $0.04169, showing bullish momentum after bouncing off the 0.618 Fibonacci retracement at $0.03947. The price is forming a strong structure with clear upward targets.
Entry Zone (Long Here): $0.03947
Target 1 (T1): $0.05362
Target 2 (T2): $0.06521
Target 3 (T3): $0.07060

FIO - For a Small Correction before a BIG MOVE!FIO as mentioned on my Monthly Analysis, Still has time, for a 4hr chart move will take shorts and mentioned red doodle because usually it slips there to fall. Expecting not to cross POC, but wil cross high because to trap shorters

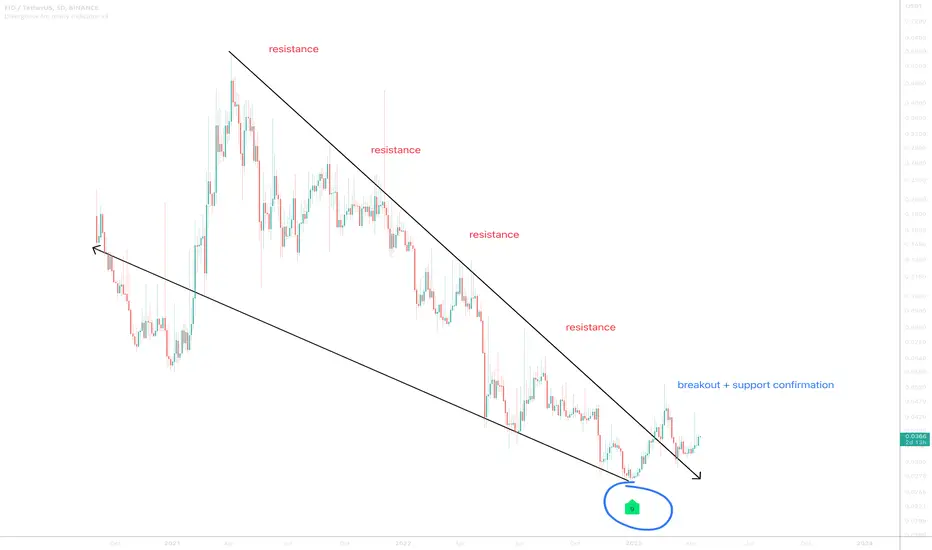
FIO / USDT : prepping for a Breakout above trendline resistance FIO/USDT: Prepping for a Breakout Above Trendline Resistance
FIO/USDT is holding its middle support zone and looks primed for a potential breakout 📈 above its trendline resistance. This setup signals a high-probability move towards bullish territory 💥. Here's why FIO/USDT is worth watching:
Key Insights:
1. Trendline Resistance: FIO is consolidating near a critical resistance level. A break above it could ignite a strong upward trend 🚀.
2. Volume Confirmation: Keep an eye out for a surge in trading volume to validate buyer interest during the breakout 📊.
3. Momentum Indicators: RSI and MACD are showing positive divergence, indicating growing bullish momentum ⚡.
Steps to Confirm the Breakout:
Look for a decisive 4H or daily candle close above the trendline 📍.
Watch for a volume spike during the breakout to confirm strong buying pressure 🔥.
A successful retest of the broken resistance as support will add confidence to the move ✅.
Stay cautious of fake breakouts, characterized by sharp reversals or false wicks ⚠️.
Risk Management Strategies:
Use stop-loss orders to limit potential losses 🔒.
Stick to proper position sizing in line with your trading plan 🎯.
This analysis is for educational purposes only and not financial advice. Always do your own research (DYOR) 🔍 before making investment decisions.

Fio/Usdt Looking GreatFIO/USDT appears to have bottomed out, with the price breaking out of a consolidation range. This suggests the possibility of a strong bullish move ahead. The breakout is happening on a higher time frame, so it might take a few days or even longer to fully materialize. However, based on current price action and market structure, I'm quite confident this could lead to significant upward momentum.
That being said, it’s essential to keep risk management in mind. Always ensure you're entering positions with a stop loss in place and manage your exposure according to your risk tolerance. If you are considering entering a trade, be mindful of possible retracements or temporary pullbacks along the way—these are common in longer-term trends.
Some additional tips:
1. Watch volume: Ensure the breakout is accompanied by solid volume, as this indicates strength in the move.
2. Support and resistance: Keep an eye on key support and resistance levels to identify potential entry or exit points.
3. Patience: Since this is a higher time-frame setup, don’t rush for short-term gains. Let the trade develop and give it time to play out.
4. Diversification: Avoid concentrating too much of your portfolio in one asset. Diversifying across assets can help reduce risk.
As always, make decisions based on your own analysis and risk profile.

FIOUSDT - GLIMPSE of MAJOR PUMP AHEAD!The Wyckoff Cycle explains market price movements in four phases driven by supply and demand. In the Accumulation Phase, smart money quietly buys assets at low prices, leading to a sideways market with limited volatility. This sets the stage for the Markup Phase, where demand outweighs supply, causing prices to rise in a clear uptrend. As prices peak, the Distribution Phase begins, where smart money sells off their holdings, resulting in another sideways market but at higher levels. Finally, the Markdown Phase occurs as selling pressure dominates, causing prices to decline in a clear downtrend, eventually leading back to a new Accumulation Phase. This cycle reflects how market participants’ psychology drives price trends.
Now as per weekly chart, as shown below, it clearly shows well accumulation before supply, many a times ive seen weekly bounce of dead sideways coin get a move and thats usually a dead cat bounce. As mentioned and seen here, I dont think its a dead cat bounce
Eying on monthly charts ,a TPO lies there stating active vol where buyers are defending thieirpositions. Henceforth, Ideal buys goes from 0.05902 where a days retest is needed.
Soon a candle to be seen big enough strong to give you good bucks!

FIOUSDT | Massive Upside PotentialI want to get involved in fiousdt as a long-term investor, but I also want the price to give a reasonable place to enter.
The green box is the area where the price may retest on the daily chart, but we can see that cryptos do not give these retests in many cases.
Therefore, if there is an upward break in the low time intervals, I will take entries from the retests there.
The green box is worth waiting for as the old high and demand zones, and the 41 cent and 30 cent zones are also worth waiting for. Don't get fooled by buying large amounts quickly. Crypto is a market that gives big corrections as well as extremely fast rises.
If you buy the levels you planned in advance on the days when everyone says the bull market is over and you have plans in case it falls even further, then you have done well. The only help I can give you is to provide these levels professionally, you can see examples of this below.
🐶 DOGEUSDT.P: Next Move
🎨 RENDERUSDT.P: Opportunity of the Month
💎 ETHUSDT.P: Where to Retrace
🟢 BNBUSDT.P: Potential Surge
📊 BTC Dominance: Reaction Zone
🌊 WAVESUSDT.P: Demand Zone Potential
🟣 UNIUSDT.P: Long-Term Trade
🔵 XRPUSDT.P: Entry Zones
🔗 LINKUSDT.P: Follow The River
📈 BTCUSDT.P: Two Key Demand Zones
🟩 POLUSDT: Bullish Momentum
🌟 PENDLEUSDT: Where Opportunity Meets Precision
🔥 BTCUSDT.P: Liquidation of Highly Leveraged Longs
🌊 SOLUSDT.P: SOL's Dip - Your Opportunity
🐸 1000PEPEUSDT.P: Prime Bounce Zone Unlocked
🚀 ETHUSDT.P: Set to Explode - Don't Miss This Game Changer
🤖 IQUSDT: Smart Plan


FIOUSDT 1WFIO ~ 1W
#FIO If you have Conviction on the coin,. Buy gradually on this resistance block if you are an aggressive trader.
But if you are a trader who plays it safe, buy gradually when retesting this resistance line. minimum target 20%+

FIOUSDTWe can attempt to buy FIOUSDT from specified level as it makes HL , also 0.618 FIB level intact indicate that it moves upward .
SL , TP mention in chart.

FIOUSDT Long-Term View:Hey there, crypto traders!
If you like my graphics, send some 💙💛
Today let's discover the chart of BINANCE:FIOUSDT consolidated in the Falling Wedge pattern.
This chart formation suggests a substantial move, potentially revisiting previous support-resistance levels.
Waiting for a confirmed breakout is crucial, guarding against premature moves that might lead to new All-Time Lows.
🎯 Key Resistance Levels:
0.019 - 0.026 - 0.036 - 0.059 - 0.088
Patience is key!

FIOUSDT (FIOProtocol) Updated till 21-09-24FIOUSDT (FIOProtocol) Daily timeframe range. it had a nice pump made some profit from local low myself. a valid close above 0.04168 can resume the push if the retrace point can hold. recent support at 0.03104.

FIO Protocol Goes Bullish (656% Mid-Term Target)The altcoins are booming... Well, maybe not yet but this is the start of the altcoins booming phase; the famously known "altcoins season."
I've been looking at many charts, hundreds of charts, in the past 25 days. There is always a mixture of situations. Some are strongly bullish, some are neutral, some are bearish. The majority of the altcoins are bullish —trading very low, near support or at new All-Time Lows.
They are not bullish because they are trading low, they are bullish because of the bullish action that is taking place after they completed a major bearish wave. Only a portion of the big ones (the giants), are bearish.
Let's look at an example: Here we have FIO protocol (FIOUSDT). The current weekly session, in a single candle, 8 weeks of bearish action have been erased. The week closes today, so this bullish signal would be confirmed within hours on a close above 0.02560.
There is massive buying in February as well and low bear volume recently. All these signals are pointing toward a trend reversal.
So why would some altcoins grow while Bitcoin moves lower?
Because these altcoins were moving lower while Bitcoin was higher.
Not everything moves at exactly the same time, the same moment. We have tens of thousands of trading pairs. The market is big and growing. Allow for major variations.
For example:
Some projects hit new All-Time Highs in 2024, others didn't.
Some projects hit new All-Time Lows in 2024 so far, many others didn't.
What one does, the others follow; this statement is true based on the broader market cycle and direction but not on the short-term and minor moves. Also, there are always exceptions to the rule.
Be blessed my dear friend and make sure to always comeback for more.
If you enjoy the content, consider hitting follow, it is the best and easiest way to show your support.
Namaste.

FIOUSDTWe can attempt to short FIOUSDT from specified level as it break HL , also bearish divergence occur indicate that it moves downward.
SL , TP mention in chart.

FIOUSDT Weekly timefarme IdeaBINANCE:FIOUSDT
A very Good project with a great chart.
first target is 0.052 and the 2nd target is 0.079
huge potential.
weekly breakout and RSI bullish Divergence spotted.
Not a financial advise.DYOR

FIOUSDT 1DKeep an eye on the #FIO daily chart. It has broken the MA200 to the upside, which is a bullish sign. Currently, it is facing falling wedge resistance and EMA200. In case of a breakout, the targets are:
$0.03519
$0.03803
$0.04087
$0.04491
$0.05006
$0.05436

FIO ANALYSIS🔮 #FIO Analysis 💰💰
🚀We saw that #FIO was trading in a falling wedge pattern and gave a breakout but currently #FIO is trading below its major resistance area. If #FIO breaks the major resistance level then we will see a good pump💲💲
🔖 Current Price: $0.03305
⏳ Target Price: $0.05566
⁉️ What to do?
- We can trade according to the chart and make some profits in #FIO. Keep your eyes on the chart, observe trading volume and stay accustom to market moves.🚀💸
#FIO #Cryptocurrency #Gain #DYOR

FIO Protocol (FIO)On the above 3-day chart price action has corrected over 90% since the sell signal April 2021 (not shown) at 50 cents. Today is great long opportunity. Why?
1) You know why.
2) RSI and price action resistance breakout.
3) Strong bullish divergence. Multiple oscillators print positive divergence with price action over an extended period.
Is it possible price action falls further? Sure.
Is it probable? No.
Ww
Type: trade
Risk: <=6% of portfolio
Timeframe: Don’t know.
Return: Will say elsewhere
FIO / cup and handleHi
On the daily frame, we see a cup and handle, the breakout occurred and then it was retested .
The model is ready, it needs liquidity.
The Target of a cup and handle is 0.052
But in chart all the targets
Stop loss close day candle below 0.039
SL 0.039 1D
Attention: This currency is slow moving, it requires patience as well
