FIOUSDT trade ideas

FIOUSDT is creating an ascending channel FIOUSDT is creating an ascending channel below the weekly resistance. IF the price is going to satisfy all our rules, According to Plancton's strategy (check our Academy ), we can set a nice order
–––––
Follow the Shrimp 🦐
Keep in mind.
🟣 Purple structure -> Monthly structure.
🔴 Red structure -> Weekly structure.
🔵 Blue structure -> Daily structure.
🟡 Yellow structure -> 4h structure.
⚫️ Black structure -> <4h structure.

FIO / TETHERUS We see the triangle is about to pump
Entry / 0.23-0.24
Target/
0.34
0.39
0.47
0.56
stop loss / 0.19

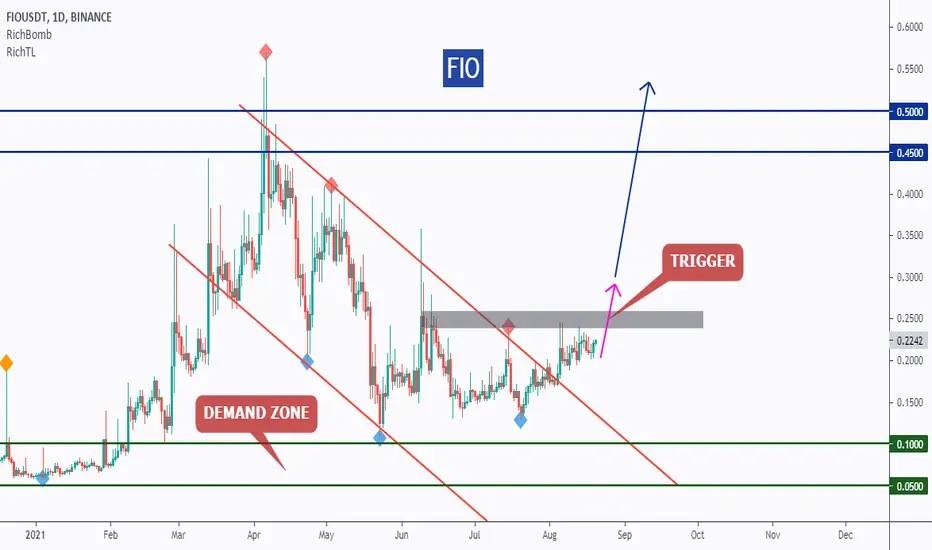
FIO - Wait For The Trigger!Hello everyone, if you like the idea, do not forget to support with a like and follow.
FIO is sitting around a strong demand zone in green so we will be looking for buy setups.
on Daily: FIO formed a valid channel in red but it is not ready to go yet.
Before we buy, we want the buyers to prove that they are taking over again.
Trigger => Waiting for a momentum candle close above the last swing high in gray to buy.
Meanwhile, until the buy is activated, FIO would be overall bearish can still trade lower.
Good luck!
All Strategies Are Good; If Managed Properly!
~Rich
FIO / My Trading Plan in 4 mins!Hello everyone, if you like the idea, do not forget to support with a like and follow.
Here is the top-down analysis for FIO, feel free to request any pair/instrument or ask any questions in the comment section below.
Best of luck!

FIO/USDT Forming Rounded BottomRounded bottoms = parabolic upside. There are 2 potential scenarios I can see happening here - either we get a pullback to the support curve and continue forming the rounded bottom, or we start to break up early. If we start breaking up early, don't buy until we break that golden pocket otherwise you will most likely find yourself at a loss until the pattern takes off. Golden pocket is very strong resistance - don't expect to break thru on the 1st try

FIO. Bounce of TrendlinePretty simple. Continuation of trend from January. Bounce here and new highs are near


Fio looking bullishIt is creating nice Cup and Handle pattern in Hourly chart can expect Bullish move


Big potential for a new entry into FIO/ USDT 60
Hello everyone, FIO / USDT is in an underlying uptrend but for now is breathing in a second short term secondary trend.
The RSI has just entered the under-sell zone, which remains a good opportunity for a new entry on support.
The confirmation of the blow line with volume will be a good validation as well as the pull back trendline.
Perhaps the safest time to know the real psychology of the market and to have the feeling of the operators.
These are not investment advice but usage recommendations.
Thank you for taking the time to read my review.
Hope you like it.
Comment on your ideas in the space dedicated to the description.
Please like and follow, thank you.

FIOUSDTEngRobo is bearish, we are neutral. Waiting at the moment. Best buy can be above $0.19 with an open/close candle present, however the downtrend line I drew is a resistance line at this moment. Buying opportunity will arise if an open/close candle is above this downtrend line. Another good time to buy is when $0.41 resistance line will turn into support line with an open/close candle above it. M+G


