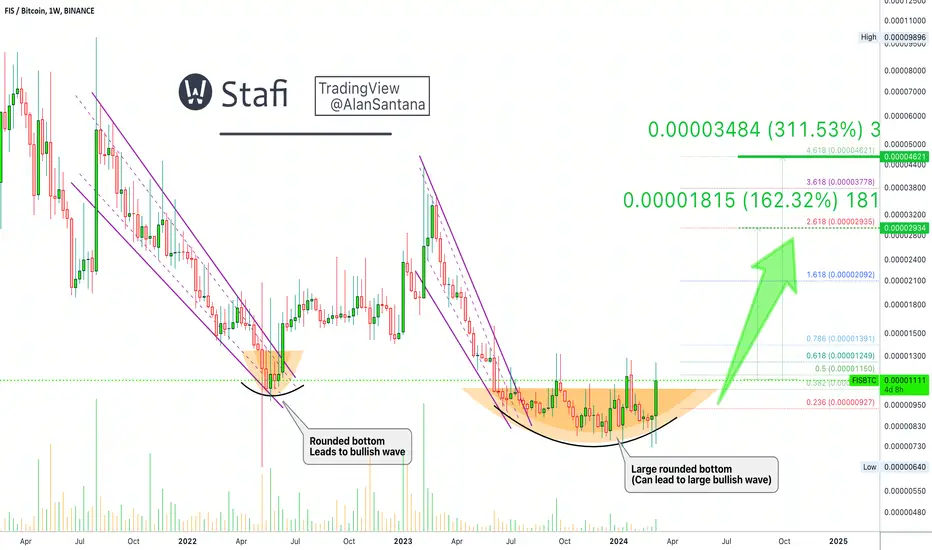
StaFi | Altcoins Market Map (What We Know So Far) — IMPORTANTWe developed a map for the Cryptocurrency market. We've been developing this map together by looking at hundreds of charts, so far, more than 500 pairs.
The great value that this map provides cannot be overstated... Let's answer some questions first before we go over the benefits of our 2024/2025 C
Related coins

✳️ StaFi | It Is Much Better Now; Better Prepared!In the past, the Cryptocurrency market would cycle through all pairs very fast and we would have tons of action all of the time. It would take 2-3 months between each bullish wave. Now it is different.
It is much better now.
Now it can take 6-9 months between each bullish wave but it is better bec
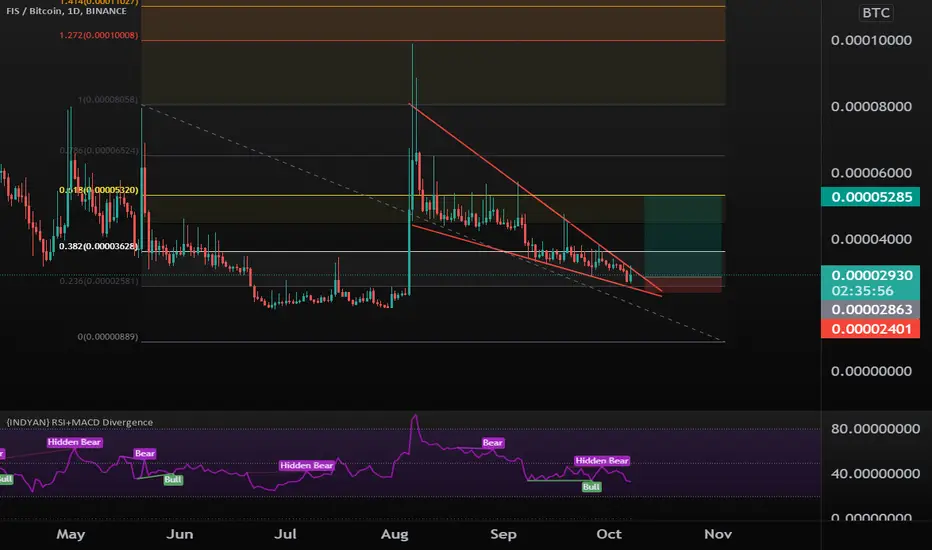
StaFi (FIS) formed a bullish Gartley for upto 42.50% moveHi dear friends, hope you are well and welcome to the new trade setup of StaFi ( FIS ) coin.
On a daily time frame, FIS has formed a bullish Gartley move
Note: Above idea is for educational purpose only. It is advised to diversify and strictly follow the stop loss, and don't get stuck with trad

FISBTCFIS looks good and I think we can trust it and publicly we see a positive movement in the coming days

Stafi (FIS) formed bullish Gartley or upto 28% moveHi dear friends, hope you are well and welcome to the new trade setup of Stafi ( FIS ) coin with BTC pair.
On a 4-hourly chart FIS has formed bullish Gartley .


FIS/BTC lookin delishmassive 4h bullish divergence + double bottom range. DYOR. Not financial advice

Double bottom patterndouble bottom pattern is a technical analysis charting pattern that describes a change in trend and a momentum reversal from prior leading price action. ...

Double bottom formationsThe double bottom pattern is a bullish reversal pattern that occurs at the bottom of a downtrend and signals that the sellers, who were in control of the price action so far, are losing momentum.
Limitations of Double Bottoms
Double bottom formations are highly effective when identified correctly.

See all ideas
Summarizing what the indicators are suggesting.
Oscillators
Neutral
SellBuy
Strong sellStrong buy
Strong sellSellNeutralBuyStrong buy
Oscillators
Neutral
SellBuy
Strong sellStrong buy
Strong sellSellNeutralBuyStrong buy
Summary
Neutral
SellBuy
Strong sellStrong buy
Strong sellSellNeutralBuyStrong buy
Summary
Neutral
SellBuy
Strong sellStrong buy
Strong sellSellNeutralBuyStrong buy
Summary
Neutral
SellBuy
Strong sellStrong buy
Strong sellSellNeutralBuyStrong buy
Moving Averages
Neutral
SellBuy
Strong sellStrong buy
Strong sellSellNeutralBuyStrong buy
Moving Averages
Neutral
SellBuy
Strong sellStrong buy
Strong sellSellNeutralBuyStrong buy
Displays a symbol's price movements over previous years to identify recurring trends.