$FIS Falling Wedge Reversal Setup:
FIS is trading inside a falling wedge — a bullish reversal pattern. Current price action near the lower trendline indicates potential for a breakout to the upside.
🔸 Upside Target: 0.2500 – 0.3000
If the price breaks above the wedge (~0.1650), a move toward 0.20 and higher targets is likely, with 0.25 and 0.30 as key resistance zones.
🔸 Risk Level at 0.1380:
A breakdown below this level would invalidate the bullish setup and suggest further downside.
🔸 Outlook:
Monitor closely for a breakout above the wedge resistance. Consider entry on breakout or near support with tight stop loss.
FISUSDT trade ideas

Chart speaks itself, huge reversal coming $FISChart speaks itself, huge reversal coming NYSE:FIS 📈⏳
let's send it higher 🤝

3.5 RREntry is a good risk:reward balance. Possible price hits target before fill, in that case, cancel the order!
FIS/USDT Long Signal – Breakout Setup✅ Entry: 0.2437 USDT
🎯 Targets:
First Target: 0.2600 USDT
Second Target: 0.2750 USDT
Third Target: 0.2850 USDT
❌ Stop Loss: 0.2291 USDT
🧠 Analysis Explanation:
The price is consolidating within a symmetrical triangle and currently testing the breakout zone near dynamic support.
An upward breakout could trigger a strong bullish move, in line with the ascending trendline support.
RSI is recovering from oversold levels, indicating potential momentum shift.
The setup offers a favorable risk/reward ratio, with the stop loss just below key support.
⚡️ Note: Wait for confirmation of breakout before entry. Use appropriate risk management based on your trading plan.

Stafi Long-Term PREMIUM Full Trade-Numbers (PP: 2063%)Stafi is now trading at bottom prices after hitting a new All-Time Low and this is a great place to enter. This is the perfect chart setup for spot traders.
Here I will share the full trade-numbers for this pair, FISUSDT, and share some of the chart technicals with you that reveal the upcoming change of trend.
Let us start with how to predict a bottom based on the chart structure and the candles.
Notice the "bearish wave" on the left side of the chart. Notice the size of the wave, the length, strength and duration. A "bear market." Simply a long-term correction.
Now, notice the "bottom wave" on the right side of the chart (orange). Notice the size, the length and duration. It is very steep. It goes very fast and it is small thus short-lived.
» The first one is a market phase/cycle while the second one is a market reaction.
» The first one led to a sideways market while the second one will lead to a change of trend.
There are two sets of numbers. Here I am only using one for the trade below but I would still like to explain this method that I use in case you want to learn to do your own numbers by looking at charts.
The first set of numbers uses the All-Time High and the bear market bottom. In this case this would be the peak price 01-March 2021 and the low set 09-May 2022. The low is the zero and the peak the one using the Fibonacci extension tool. The 1.618 is the standard ATH projection. If you are feeling confident, the market is producing strong higher lows, the pair is good, there is strong volume, etc. You can also consider the 2.618 level which is not shown on this chart. Of course, if you move the chart up a little bit you can easily see it.
The second set uses the current market bottom, in this case the low 7-April 2025 and the previous high, 09-Dec 2024. This will give you a set of numbers that you can use to extract also some short-term targets. The first set would only have long-term targets.
When a trading pair produces new All-Time Lows we say that a new All-Time High is not likely but this isn't necessarily true, this is a technical assumption. The truth is that anything is possible and not even the insiders and exchanges who control the bots that control the price of a chart know how far up a pair can really go. When the euphoria phase of a bull market starts it is hard to maintain control.
A bullish wave can be neutralized with massive selling pressure. This is done all of the time. If any trading pair starts to grow organically for whatever reason on any exchange, the bots owned by the exchange immediately start selling and balance thing out, they just don't like things moving in ways that they do not control.
Anyway, let's continue; Full trade-numbers below:
_____
FISUSDT (PP: 2063%)
CURRENT PRICE: $0.1263
ENTRY:
1) $0.1420
2) $0.1150
3) $0.0999
TARGETS:
TP1: $0.1852
TP2: $0.2361
TP3: $0.3206
TP4: $0.3889
TP5: $0.4571
TP6: $0.5543
TP7: $0.6781
TP8: $0.8888
TP9: $1.0356
TP10: $1.2566
TP11: $1.4140
TP12: $1.6141
TP13: $2.1926
TP14: $2.7711
STOP: Close monthly below $0.0990
_____
No stop-loss. When trading spot you should be ready to wait for years. That's the mindset. If you are not ready to wait for years, well, you can do whatever you want of course but with this mindset you can never go wrong. There are many ways to approach a trading pair but sometimes we are ready to wait 3 months for a bullish wave and yet it takes 6 months for the wave to develop. Next time we are ready to wait 6 months to see prices go up but the wave starts in 12 months and so on. So always be ready to wait 4-5 times longer than what you initially think is the necessary time for the market to change course. Never place a stop-loss in an exchange because that is just bad for the market, the bots will sell just to active your stop.
Stop-loss orders should be avoided at all cost if you are a beginner or a spot trader. Simply buy and hold.
You can use a stop-loss trading short-term and in many different systems but I am talking about reality here, it is not the same.
Never close a trade out of a whim. Either you do it or yo don't. Either you plan or you don't trade.
If you plan you will be successful and you will achieve success. If you don't plan, you can make money but you will be gambling and this gambling will end up in negative results in the long-term. So, if you are not ready to plan/prepare then just wait, the market is not going away. When you are ready, enter with a plan and you will win for sure.
The plan is easy, what to do when the market moves in a certain way. If it rises, will I sell or hold? If it drops, will I sell or hold? If you decide the answer is to hold then, for how long? If you decide the answer is to sell, how much? Just prepare for all scenarios. You don't have to do anything really other than buy low (now) and sell high (later), but doing the mental exercise will save you from stupid mistakes when excitement (or anxiety) grows.
Just practice.
Success is yours.
Thanks a lot for your continued support.
If you enjoy the content, just follow.
Namaste.

FISUSDT (Do OR Die Condition)If you are really interested in buying this coin and also want to add a stoploss, just buy if its closing daily candles above 0.22 and sell if closes daily candles below 0.22 and so on, if closing above wait for the targets and if closing below sell, and wait for again reclaim 0.22 and buy again
StaFi is the first DeFi protocol unlocking liquidity of staked assets. Users can stake PoS tokens through StaFi and receive rTokens in return, which are available for trading, while still earning staking rewards.

FIS - Triple Bottom Formation with Massive Targets |1H- 1W VIEWTECHNICAL ANALYSIS: 🎯
Pattern Structure:
- Price: $0.4667 (-2.24%)
- Timeframe: Weekly (1W)
- Clear triple bottom formation (2022-2024)
- Strong horizontal support: $0.42
Major Price Targets:
TP1: $1.2867 (344.08% potential)
TP2: $2.3459 (501.44% potential)
Technical Insights:
- Triple bottom pattern confirmed with three tests of $0.42 support
- Multiple touches of resistance at $0.90-1.00 zone
- Clear bullish divergence on weekly timeframe
- Moving averages showing potential golden cross setup
THIS 1H CHART VIEW
Key Levels:
▪️ Major Support: $0.42 (Must Hold)
▪️ Immediate Resistance: $0.90
▪️ Breakout Level: $1.00
Risk Management:
- Entry Zone: $0.45-0.48
- Stop Loss: Below $0.40 (Weekly close)
- Risk:Reward ratio
• To TP1: 1:15
• To TP2: 1:25
Timeframe: Weekly
Bias: Strong Bullish on Break
Pattern: Triple Bottom / Accumulation
Note: Such high targets require patience and proper position sizing. This is a long-term setup. Not financial advice.
#FIS #Crypto #TechnicalAnalysis #Binance
Key Observation: Pattern suggests massive accumulation phase since 2022, with potential for significant upside movement on volume confirmation.

Get Ready to BUY SPOT FISUSDT on D1 Cycle
🌟 Capture the Momentum with FISUSDT! 🌟
🌍 Market Overview:
FISUSDT is showing strong bullish potential on the D1 timeframe, offering a great opportunity to capitalize on its momentum.
📊 Trade Plan:
📌 Entry: $0.45 - $0.51 – Ideal accumulation range before the breakout.
🎯 Target: x1.5 – Aiming for a 50% profit gain in the short term.
⏳ Hold Time: 1-2 weeks – Strategic short-term hold aligned with the D1 cycle.
🔍 Strategy Insights:
My custom tool RainBow MG3 highlights a high probability of upward movement.
Market trends suggest a strong setup with favorable risk-to-reward ratios.
🚀 Next Steps:
💬 Reach out if you need further support or detailed strategies!
💡 Note: This is not financial advice. Always DYOR before trading.
🔥 FISUSDT is primed for an exciting move – Are you ready to take action? 🔥

FISUSDT Is With Good VolumeFIS is a cryptocurrency token that powers StaFi, a protocol for trading staked assets as derivatives. StaFi operates on the Ethereum platform and uses a DAO structure to decentralize control and distribute security responsibility across multiple stakeholders
Currently buyers are Taking interest in this Strong Project. Expecting 200 % + Gain in this Move.
Overall Market is taking breath but FIS is still getting good volume.


FISUSDT: This Key Metric Could Define the Future - Stafi◳◱ On the BINANCE:FISUSDT chart, the Bband Breakout Super-Trend pattern suggests an upcoming trend shift. Traders might observe resistance around 0.4346 | 0.4671 | 0.5427 and support near 0.359 | 0.3159 | 0.2403. Entering trades at 0.5039 could be strategic, aiming for the next resistance level.
◰◲ General Information :
▣ Name: Stafi
▣ Rank: 714
▣ Exchanges: Binance, Huobipro, Gateio, Mexc
▣ Category / Sector: Financial - Derivatives
▣ Overview: None
◰◲ Technical Metrics :
▣ Current Price: 0.5039 ₮
▣ 24H Volume: 1,992,676.241 ₮
▣ 24H Change: 5.463%
▣ Weekly Change: 24.00%%
▣ Monthly Change: 53.27%%
▣ Quarterly Change: 69.61%%
◲◰ Pivot Points :
▣ Resistance Level: 0.4346 | 0.4671 | 0.5427
▣ Support Level: 0.359 | 0.3159 | 0.2403
◱◳ Indicator Recommendations :
▣ Oscillators: BUY
▣ Moving Averages: STRONG_BUY
◰◲ Summary of Technical Indicators : STRONG_BUY
◲◰ Sharpe Ratios :
▣ Last 30 Days: 4.56
▣ Last 90 Days: 2.55
▣ Last Year: 0.73
▣ Last 3 Years: 0.25
◲◰ Volatility Analysis :
▣ Last 30 Days: 1.16
▣ Last 90 Days: 0.88
▣ Last Year: 1.15
▣ Last 3 Years: 1.20
◳◰ Market Sentiment :
▣ News Sentiment: N/A
▣ Twitter Sentiment: N/A
▣ Reddit Sentiment: N/A
▣ In-depth BINANCE:FISUSDT analysis available at TradingView TA Page
▣ Your thoughts matter! What do you think of this analysis? Share your insights in the comments below. Your like, follow, and support are greatly valued and help sustain high-quality content.
◲ Disclaimer : Disclaimer
The content provided is for informational purposes only and does not constitute financial, investment, or trading advice. Always conduct your own research and consult a qualified professional before making any financial decisions. Use of the information is solely at your own risk.
▣ Explore the Power of Charting with TradingView
Unlock a wide range of financial analysis tools, data, and features to elevate your trading experience. Take a tour and see the possibilities. If you decide to upgrade your plan, you can receive up to $30 back. Discover more here - affiliate link -

#FIS: Unlocking Decentralized Financial ServicesDescription:
This trading idea focuses on FIS (Stafi), a decentralized finance (DeFi) protocol designed to unlock liquidity for staked assets. By utilizing its unique rToken system, FIS allows users to stake their digital assets and receive tradable tokens in return, enabling liquidity without sacrificing staking rewards. This innovation positions FIS as a pivotal player in the DeFi space, addressing a critical limitation in traditional staking. With the growing adoption of staking in blockchain ecosystems, FIS has significant potential to attract users seeking flexible and liquid staking solutions.
It’s important to note that the cryptocurrency market is highly volatile and influenced by various factors such as regulatory changes, technological advancements, and market sentiment. As a result, trading or investing in FIS involves substantial risks and requires proper risk management strategies.
Disclaimer:
This trading idea is provided for educational purposes only and does not constitute financial advice. Trading cryptocurrencies like FIS carries significant risk, including the potential for total capital loss. Always perform thorough research, assess your financial circumstances, and consult a professional financial advisor before making investment decisions. Past performance is not indicative of future results.
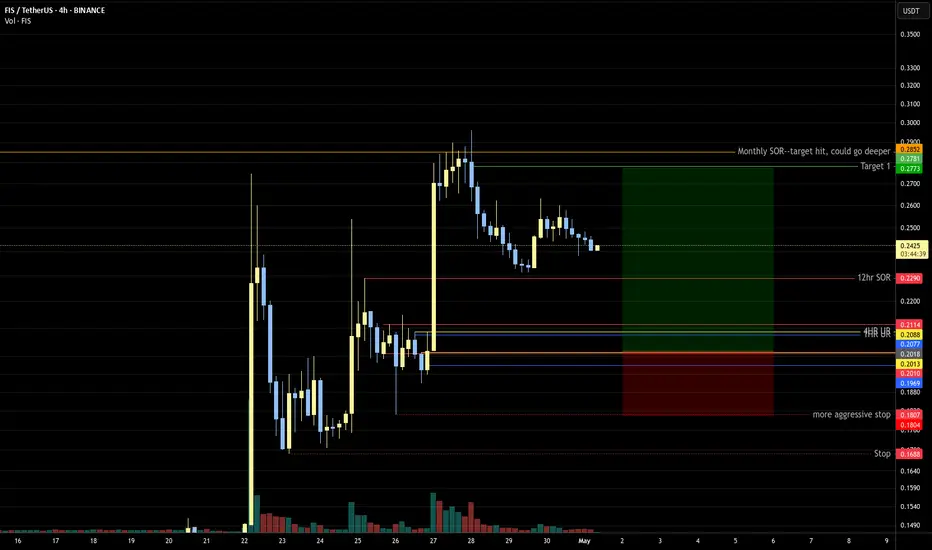
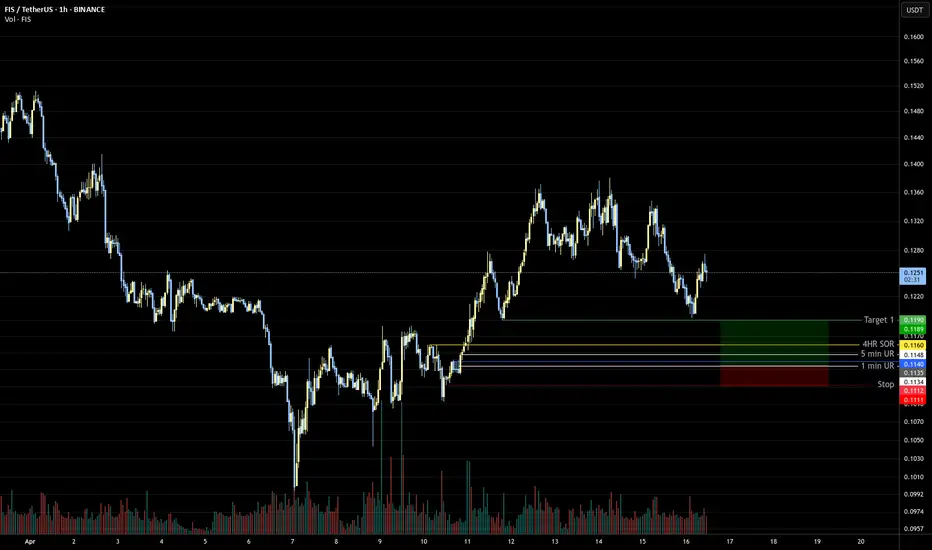
FISUSDT Long IdeaFIS has retraced the liquidity left behind with the huge 4hr candle from Monday's trading. It has so far seen $34.2m in USDT volume in the last 24hrs, so there's liquidity activity on the pair. No fair value gap was left at the base, showing the intent of the market maker to keep price action as neat as possible. Price nestled on the 4hr 50ema and has bounced. An entry on the retest, to go fill the 50% of the 4hr wick at the top, would return a decent 10.5RR with invalidation below 4%.

FIS Risk-reward 1/4💰 FIS #LONG
➕Open positions 0.33-0.32
📈 Take profit: 0.35
📈Take-Profit: 0.38
📈Take profit: 0.42
⛔️ 📉 Stop Loss: 0.30
🔥Risk-reward ratio 1/4
🆘 Recommended trading volume: 5% of your deposit amount.❗️

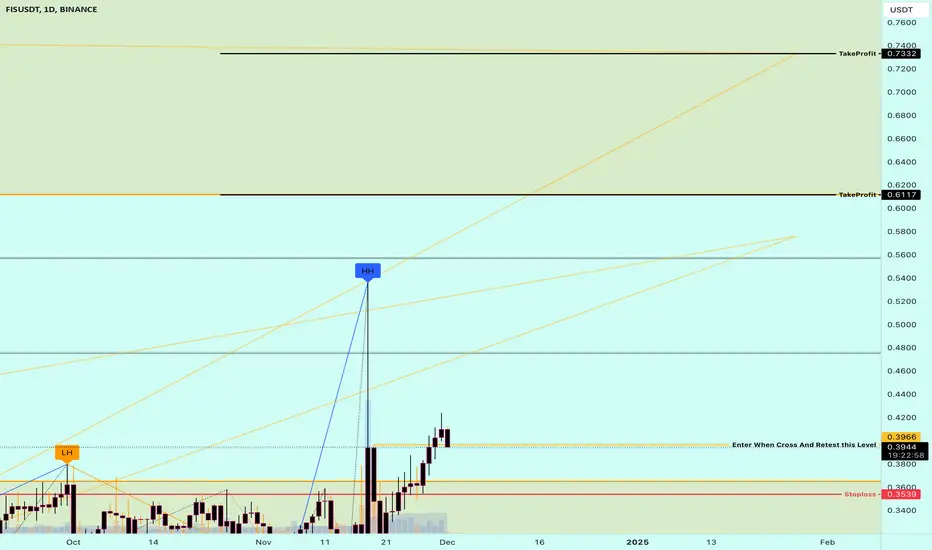
FISUSDT.1DIn my technical analysis of the FIS/USDT daily chart, I observe several critical elements that suggest a pattern of consolidation followed by a potential breakout. The chart displays a series of lower highs and higher lows, forming a converging pattern indicative of a symmetrical triangle. This is typically a continuation pattern, suggesting that the price may soon make a significant move in the direction of the prevailing trend.
The resistance levels I've identified, R1 at $0.3829 and R2 at $0.4538, are pivotal for determining FIS's short-term price trajectory. Currently, the price is testing R1, and a sustained break above this level could signal increased bullish momentum, targeting R2.
Conversely, the support levels, S1 at approximately $0.2450, which is also the triangle's lower boundary, play a crucial role. A break below this support could indicate a shift to bearish sentiment, potentially leading to further declines towards lower price levels.
Volume analysis will be critical in confirming the breakout direction. An increase in volume on a move above R1 would validate the breakout, increasing the likelihood of reaching R2. However, a breakout to the downside with substantial volume might compel me to reassess my bullish stance and consider defensive strategies.
Given the current market conditions and historical price action of FIS, my strategy involves closely monitoring the price as it approaches these critical junctures. I am prepared to increase my long exposure if the price convincingly breaks above R1 with robust volume. On the flip side, I will set stop-loss orders just below S1 to protect my positions from an unexpected downturn.

FIS - Pullback Mode (volatility --StaFI like many other projects is printing some volume candles to the upside..
I am planning to observe if is recommended to catch these pullbacks before bigger pumps occur
Short term targets here on-chart ✌️

✴️ Stafi | Moving Averages Part 7 (255%+ Profits Potential)Stafi has been growing for more than three months straight; higher highs and higher lows after a major correction from the initial 2023 bullish wave.
There is no change in trading volume in the last six months, yet prices continue to grow.
Stafi (FISUSDT) is now trading above all long-term moving averages, EMA300, EMA200, MA200; Bulls confirmed.
Volume will show up massively when the bullish action really starts.
The low volume means that nothing is really happening, technically speaking; everything is the same.
Even though we have more than 100% growth since the September low... But this is only a recovery of something that was initially lost.
The reason why it can keep on moving forward, it can keep on growing is because of the long-term loss.
The All-Time High stands beyond $5, the current price at $0.45 is very low... The bigger picture, always zoom-out if you really want to know what is going on.
This is only the beginning... The best is yet to happen.
👉 2025 & 2024. The Cryptocurrency market bull-run.
Namaste.

StaFi (FIS) - bullish divergenceOn the above 2-day chart price action has corrected 70% since February. A number of reasons now exist to consider a long position..
Firstly, was asked about my thoughts on this one. It is bullish. Here’s why:
1) Price action and RSI resistance breakouts.
2) Regular AND hidden bullish divergence, don’t often see that. 10 oscillators are currently printing positive divergence with price action. Latterly hidden bullish divergence is printing as 1) price action prints a higher low and 2) stochastic RSI prints a lower low.
3) Support and resistance. Look left, blue circles. Price action is on strong support.
4) The bull flag breakout. The flagpole measures a 220% return from current levels. Sound good?
Is it possible price action continues to fall? Sure.
Is it probable? no.
Ww
Type: trade
Risk: <2%
Timeframe for long: act now
Return: 2x

FIS LOOKS BULLISHIt has a boolean structure.
It has a good range for rebuy, which we have marked with green color
The targets are clear on the chart.
Closing a daily candle below the invalidation level will violate the analysis
For risk management, please don't forget stop loss and capital management
When we reach the first target, save some profit and then change the stop to entry
Comment if you have any questions
Thank You

#FIS/USDT#FIS
We have been in a descending triangle since the beginning of 2022.
Supported by stability above Moving Average 100
We have upward momentum and support from a good area.
Current price 0.4157.
The first target 0.5739.
Second target: 0.7350
The third goal 0.9712

FIS lots of potential (targets) - Stafi (FIS) has not yet reached it's true price value (potential).
There are some coins on Binance with this pattern..
My guess altcoins are trying to make a cup and handle pattern
We can see on this chart one.. more easily
For any Request with Targets for Alts ,you can leave a comment bellow..

FISUSDT.1DBased on the provided market data, the FIS currency is currently trading at $0.51 against the USDT. The Relative Strength Index (RSI) for 4 hours, 1 day, and 7 days is 73.86, 80.24, and 67.06 respectively. The RSI values suggest that the currency is currently in the overbought territory, especially on the 1-day chart, which might suggest a potential downward correction in the near term.
The Moving Average Convergence Divergence (MACD) for 4 hours, 1 day and 7 days is 0.011, 0.0175, and 0.034 respectively. The positive MACD values indicate that the currency is on an upward trend.
The Bollinger Bands (Bb) for 4 hours, 1 day and 7 days are all at 0.51, which is exactly at the current price, indicating a balanced market with equal buying and selling pressure.
The support levels for 4 hours, 1 day, and 7 days are $0.48, $0.45, and $0.38 respectively, while the resistance levels are $0.52, $0.53, and $0.53. The currency is currently just below the first resistance level on all charts, suggesting a strong resistance at this level.
In summary, the FIS currency is currently in an upward trend but is in the overbought territory, suggesting a potential downward correction. However, the MACD indicates continued upward momentum. It's a mixed signal situation where caution is advised. As always, additional factors should be considered and getting professional financial advice is recommended.
