Mlem mlem - FLM USDTFLMUSDT if luck is lucly then u see orange or if not so lucky so the red ones happen!
FLMUSDT trade ideas
#FLM/USDT – Bullish Reversal Opportunity | 1H Chart #FLM
The price is moving within a descending channel on the 1-hour frame, adhering well to it, and is on its way to breaking it strongly upwards and retesting it.
We have a bounce from the lower boundary of the descending channel. This support is at 0.0257.
We have a downtrend on the RSI indicator that is about to break and retest, supporting the upside.
There is a major support area in green at 0.0248, which represents a strong basis for the upside.
Don't forget a simple thing: ease and capital.
When you reach the first target, save some money and then change your stop-loss order to an entry order.
For inquiries, please leave a comment.
We have a trend to hold above the 100 Moving Average.
Entry price: 0.0257.
First target: 0.0270.
Second target: 0.0285.
Third target: 0.0301.
Don't forget a simple thing: ease and capital.
When you reach the first target, save some money and then change your stop-loss order to an entry order.
For inquiries, please leave a comment.
Thank you.

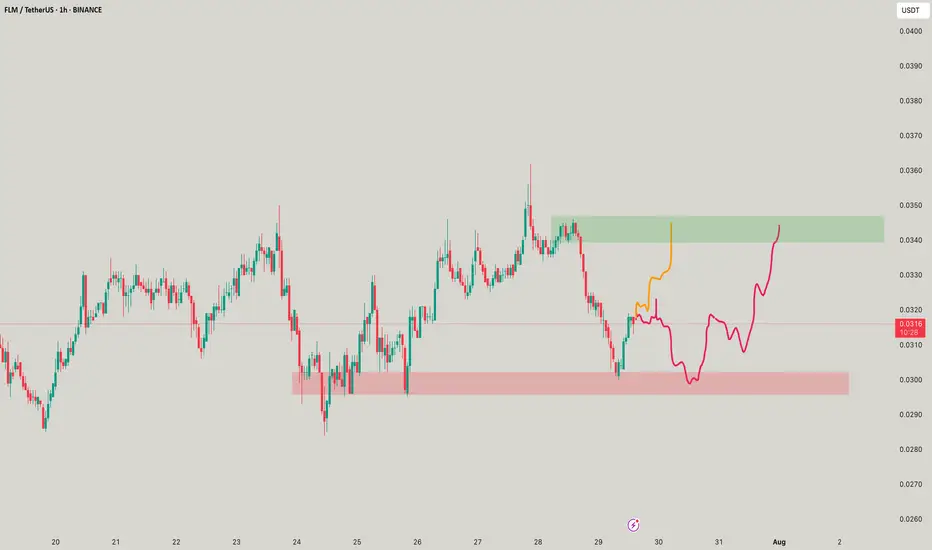
#FLM/Usdt Breakout ?#FLM
The price is moving within a descending channel on the 1-hour frame and is expected to break and continue upward.
We have a trend to stabilize above the 100 moving average once again.
We have a downtrend on the RSI indicator that supports the upward break.
We have a support area at the lower boundary of the channel at 0.0323, acting as strong support from which the price can rebound.
We have a major support area in green that pushed the price upward at 0.0315.
Entry price: 0.0327.
First target: 0.0342.
Second target: 0.0351.
Third target: 0.0364.
To manage risk, don't forget stop loss and capital management.
When you reach the first target, save some profits and then change the stop order to an entry order.
For inquiries, please comment.
Thank you.

Flm usdt Neo wave analysis 🧐
Hello to every trader and analyst With the wave analysis of this currency at your service The mentioned symbol has entered an impulse movement, where wave 1 has formed an accelerated rally movement Wave 2 is formed as a triangle that can correct wave 1 to the level of 618 From the Fibonacci point on the chart, we can expect an impulse wave in the form of wave 3 and then continue the path
be profitable
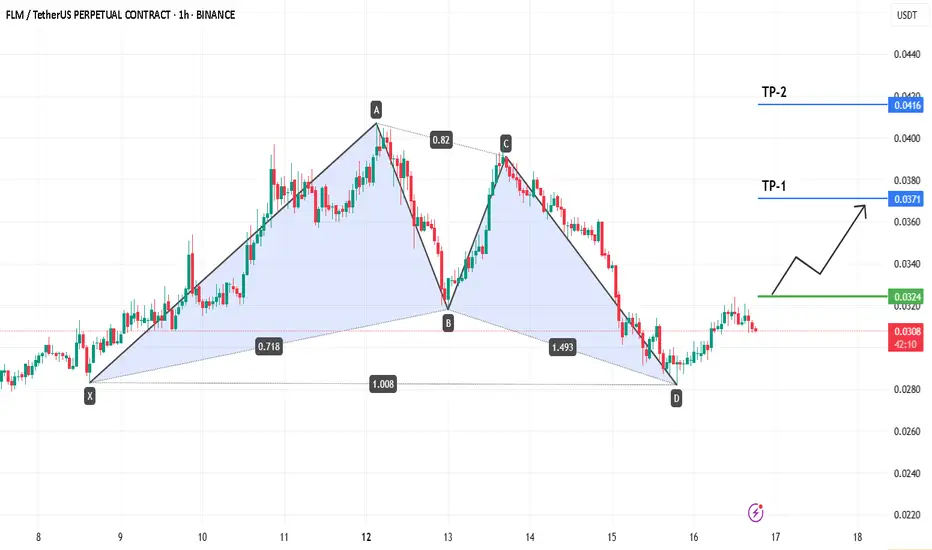
Let's go for a beautiful butterfly pattern.

FLM/USDT | 1H Timeframe FLM has recently completed a Bullish Butterfly Harmonic Pattern on the 1-hour chart, signaling a potential reversal from the D point. "
✅ Trade Idea:
Entry Zone: 0.0324 – 0.0330
Stop Loss: Below 0.0300 (structure invalidation)
Take Profit 1 (TP-1): 0.0371
Take Profit 2 (TP-2): 0.0416
⚠️ Risk Management:
Always apply proper risk management. Harmonic patterns are powerful tools, but no setup is guaranteed. Use calculated lot sizes and respect your stop-loss to protect capital.
💬 Please share your thoughts in the comments and hit the like button if you agree with this setup!
FLM/USDT – Bullish Reversal Opportunity | 1H Chart AnalysisFLM has completed a bullish harmonic pattern and formed a strong base around $0.0300–$0.0324, showing signs of accumulation. A breakout above the range suggests a potential bullish move.
📌 Entry: $0.0324
🎯 Target (TP-1): $0.0371
🎯 Final Target: $0.0414
🛡️ Stop Loss: $0.0279
RSI shows bullish divergence, supporting the upward momentum. Breakout confirmation above resistance may trigger a 25–28% upside. Trade with proper risk management.

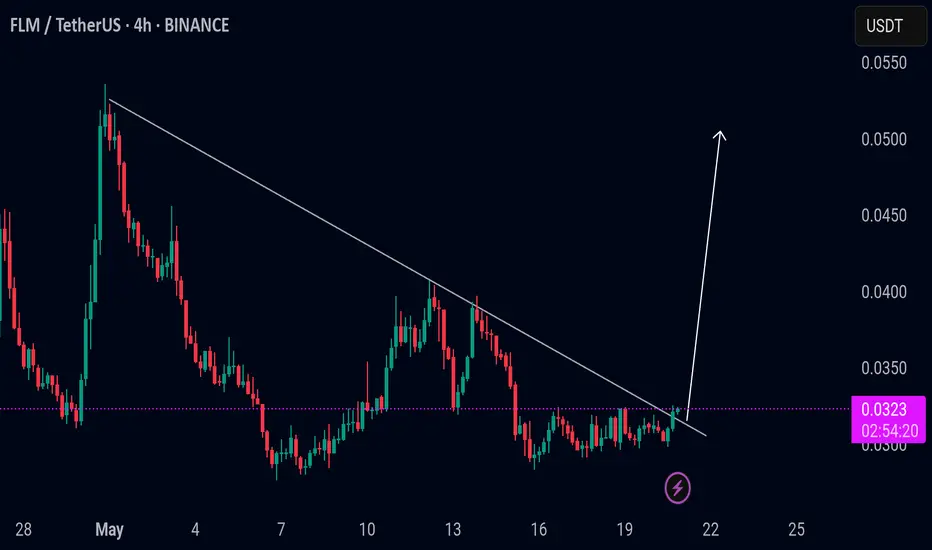
FLM Breaking Out of Descending Triangle – Bullish Momentum Ahead🔥 CSE:FLM – Breakout in Play
On the 4H timeframe, FLM is breaking out of a descending triangle — a structure that often leads to upward moves when broken to the upside 🔺
The retest looks clean, showing signs of bullish strength from buyers 🟢
If momentum continues, FLM could be setting up for a strong bullish leg 📈
👀 Stay focused — this could be the start of something big!

Flm/Usdt BreakoutFLMUSDT:
FLM is now trading around $0.0323. FLM already broke out of the trend line on the 4-hour timeframe and looks bullish. So, the possible scenario, according to the pattern, is bullish momentum in FLM, and it could pump up to 20–30%. Otherwise, if it dumps and trades inside the triangle again, the breakout will be considered a fakeout. Keep an eye on it.
$BINANCE:FLMUSD : new setup flamingo tokenBINANCE:FLMUSD flamingo token is brok first resistance and we can see next level of resistance in pitchfork

FLM/USDTKey Level Zone: 0.0360 - 0.0370
HMT v8.1 detected. The setup looks promising, supported by a previous upward/downward trend with increasing volume and momentum, presenting an excellent reward-to-risk opportunity.
HMT (High Momentum Trending):
HMT is based on trend, momentum, volume, and market structure across multiple timeframes. It highlights setups with strong potential for upward movement and higher rewards.
Whenever I spot a signal for my own trading, I’ll share it. Please note that conducting a comprehensive analysis on a single timeframe chart can be quite challenging and sometimes confusing. I appreciate your understanding of the effort involved.
Important Note :
Role of Key Levels:
- These zones are critical for analyzing price trends. If the key level zone holds, the price may continue trending in the expected direction. However, momentum may increase or decrease based on subsequent patterns.
- Breakouts: If the key level zone breaks, it signals a stop-out. For reversal traders, this presents an opportunity to consider switching direction, as the price often retests these zones, which may act as strong support-turned-resistance (or vice versa).
My Trading Rules
Risk Management
- Maximum risk per trade: 2.5%.
- Leverage: 5x.
Exit Strategy
Profit-Taking:
- Sell at least 70% on the 3rd wave up (LTF Wave 5).
- Typically, sell 50% during a high-volume spike.
- Adjust stop-loss to breakeven once the trade achieves a 1.5:1 reward-to-risk ratio.
- If the market shows signs of losing momentum or divergence, ill will exit at breakeven.
The market is highly dynamic and constantly changing. HMT signals and target profit (TP) levels are based on the current price and movement, but market conditions can shift instantly, so it is crucial to remain adaptable and follow the market's movement.
If you find this signal/analysis meaningful, kindly like and share it.
Thank you for your support~
Sharing this with love!
HMT v2.0:
- Major update to the Momentum indicator
- Reduced false signals from inaccurate momentum detection
- New screener with improved accuracy and fewer signals
HMT v3.0:
- Added liquidity factor to enhance trend continuation
- Improved potential for momentum-based plays
- Increased winning probability by reducing entries during peaks
HMT v3.1:
- Enhanced entry confirmation for improved reward-to-risk ratios
HMT v4.0:
- Incorporated buying and selling pressure in lower timeframes to enhance the probability of trending moves while optimizing entry timing and scaling
HMT v4.1:
- Enhanced take-profit (TP) target by incorporating market structure analysis
HMT v5 :
Date: 23/01/2025
- Refined wave analysis for trending conditions
- Incorporated lower timeframe (LTF) momentum to strengthen trend reliability
- Re-aligned and re-balanced entry conditions for improved accuracy
HMT v6 :
Date : 15/02/2025
- Integrated strong accumulation activity into in-depth wave analysis
HMT v7 :
Date : 20/03/2025
- Refined wave analysis along with accumulation and market sentiment
HMT v8 :
Date : 16/04/2025
- Fully restructured strategy logic
HMT v8.1 :
Date : 18/04/2025
- Refined Take Profit (TP) logic to be more conservative for improved win consistency

$FLM/USDT Breakout AlertAfter a strong accumulation phase, CSE:FLM just broke out of a descending trendline with volume confirmation!
Entry: 0.0154
SL: 0.0137
Target: 0.0269
Price broke above the trendline + 50ema, signalling a potential trend reversal.
Bullish momentum is building; eyes are on the next key level!
Are you riding this breakout? 👀

FLMUSDT CHART ANALYSİS - EDUCATIONAL POSTHow NFT Technology Developed
NFT technology was created in 2017 based on Ethereum smart contracts. Since then, we have witnessed many successful NFT projects and deals. Stories like these perfectly describe the current and future possibilities of the technology.
The development of blockchain technology and the emergence of NFT services coincided with other processes in society and the economy. Many new players appeared in the stock markets, including non-professional traders and amateur investors.
The democratization of financial markets coincided with the pandemic: being in self-isolation, alone with their devices, many people began to pay attention to new financial instruments.
The information that arose around them also played a specific role in the “revival” of NFTs. The big names in the news headlines supporting NFTs couldn’t help but draw attention to them.
That is one of the reasons why the success of the technology was inevitable.

FLMUSDT 1WFLM ~ 1W
#FLM If you still have Conviction on this coin, buy it gradually from here with a minimum target of 20%++

FLMUSDT: Watching for Buyer Activity in the Blue Box FLMUSDT: Watching for Buyer Activity in the Blue Box 🚨
FLMUSDT is in an interesting spot, folks. Here’s what we know:
Active Sellers: Currently, sellers are dominating, but this could change quickly.
Stops at 0.039: This level is key for managing risk and planning entries.
Blue Box Opportunity: This is where I’m expecting potential buyer activity to pick up. It’s critical to keep an eye on this zone for signs of a reversal.
Confirmation Tools: Check CDV (Cumulative Delta Volume) and volume profile as price enters the blue box. These will help identify if buyers are stepping in with strength.
My Plan:
If we see buyers showing up in the blue box with bullish market structure on lower timeframes (1H or lower), this could present a strong long opportunity. Until then, patience is key!
Stay sharp, traders these setups can move fast. Boost, comment, and follow for more actionable insights! 🚀
Let me tell you, this is something special. These insights, these setups—they’re not just good; they’re game-changers. I've spent years refining my approach, and the results speak for themselves. People are always asking, "How do you spot these opportunities?" It’s simple: experience, clarity, and a focus on high-probability moves.
Want to know how I use heatmaps, cumulative volume delta, and volume footprint techniques to find demand zones with precision? I’m happy to share—just send me a message. No cost, no catch. I believe in helping people make smarter decisions.
Here are some of my recent analyses. Each one highlights key opportunities:
🚀 RENDERUSDT: Strategic Support Zones at the Blue Boxes +%45 Reaction
🎯 PUNDIXUSDT: Huge Opportunity | 250% Volume Spike - %60 Reaction Sniper Entry
🌐 CryptoMarkets TOTAL2: Support Zone
🚀 GMTUSDT: %35 FAST REJECTION FROM THE RED BOX
🎯 ZENUSDT.P: Patience & Profitability | %230 Reaction from the Sniper Entry
🐶 DOGEUSDT.P: Next Move
🎨 RENDERUSDT.P: Opportunity of the Month
💎 ETHUSDT.P: Where to Retrace
🟢 BNBUSDT.P: Potential Surge
📊 BTC Dominance: Reaction Zone
🌊 WAVESUSDT.P: Demand Zone Potential
🟣 UNIUSDT.P: Long-Term Trade
🔵 XRPUSDT.P: Entry Zones
🔗 LINKUSDT.P: Follow The River
📈 BTCUSDT.P: Two Key Demand Zones
🟩 POLUSDT: Bullish Momentum
🌟 PENDLEUSDT.P: Where Opportunity Meets Precision
🔥 BTCUSDT.P: Liquidation of Highly Leveraged Longs
🌊 SOLUSDT.P: SOL's Dip - Your Opportunity
🐸 1000PEPEUSDT.P: Prime Bounce Zone Unlocked
🚀 ETHUSDT.P: Set to Explode - Don't Miss This Game Changer
🤖 IQUSDT: Smart Plan
⚡️ PONDUSDT: A Trade Not Taken Is Better Than a Losing One
💼 STMXUSDT: 2 Buying Areas
🐢 TURBOUSDT: Buy Zones and Buyer Presence
🌍 ICPUSDT.P: Massive Upside Potential | Check the Trade Update For Seeing Results
🟠 IDEXUSDT: Spot Buy Area | %26 Profit if You Trade with MSB
📌 USUALUSDT: Buyers Are Active + %70 Profit in Total
🌟 FORTHUSDT: Sniper Entry +%26 Reaction
🐳 QKCUSDT: Sniper Entry +%57 Reaction
📊 BTC.D: Retest of Key Area Highly Likely
This list? It’s just a small piece of what I’ve been working on. There’s so much more. Go check my profile, see the results for yourself. My goal is simple: provide value and help you win. If you’ve got questions, I’ve got answers. Let’s get to work!

$FLM pay attentionJust pay attention at FLM it could breakout resistance
Price at 200EMA and 61fibo it's a good point but also look at the CRYPTOCAP:BTC becuase it's leader of market

FLM breakout: Uptrend outside the parallel channelFLM is coming out of the parallel channel! It is worth paying attention to this project, it looks quite bullish from a technical point of view. Exit from the parallel channel, consolidation above 50 EMA, RSI is also not overloaded. I wouldn't have high hopes, but the 0.382 area looks conservative and logical.
Horban Brothers.

FLM USDT#FLM
Flamingo Finance is breaking the falling wedge formation on the weekly chart🧐
Keep an eye on the price action near the broken resistance👀
A bounce could lead to an upward movement towards targets at $0.12, $0.15, $0.32 and $0.45👨💻


FLMHigh frame Analysis for investors , selling at 0.1$ and reacumlate later .
the chart tells all infos.

FLMUSDTFLM ~ 1W
#FLM The pressure/decline on this coin seems to have weakened. If you have Conviction on this coin,. At least a 20%+ increase from here isn't difficult.

LONG SETUPHere we had a wedge pattern that price has hitted it upward . But after consolidation has dropped. Now I think it will rise up to the massive liquidity levels. So I'm bullish on FLM.

FLMUSDT 1:1 Long Setup SettingBINANCE:FLMUSDT
OKX:FLMUSDT
SL1 ---> Low-risk status: 3x-4x Leverage
SL2 ---> Mid-risk status: 5x-8x Leverage
👾The setup is active but expect the uncertain phase as well.
➡️Entry Area:
Yellow zone
⚡️TP:
0.0523
0.0531
0.0540
0.0550
🔴SL:
0.048
🧐The Alternate scenario:
If the price stabilizes below the trigger zone, the setup will be cancelled.

FLMUSDTWe can attempt to buy FLMUSDT from specified level if it break LH , also bullish divergence occur indicate that it moves upward.
SL , TP mention in chart.
