FLOKI on Fire! Bullish Summer for FLOKIUSDTDuring the two-month period from July to August, it's unclear what the specific catalyst might be, but Floki appears poised for a price surge between 75% to 133%. The June low at 0.00005923 seems to mark a solid bottom, and from here, I anticipate a bullish trend in Floki’s price.
FLOKIUSDT trade ideas

Caution is requiredA test was made near the last minor peak and it could not break it and fell and there is a fifth side left to close wxyxxz
*In principle, I am not a supporter of any direction, but I am only giving my point of view, which may be right or wrong. If the analysis helps you, then this is for you. If you do not like this analysis, there is no problem. Just ignore it. My goal is to spread the benefit. I am not one of the founders of the currency.

Floki (FLOKI): Possible H&S Pattern Forming | Neckline Area Floki coin is pressuring the local neckline area, which could give us a good opportunity for a breakdown and 33% of market price movement to lower zones.
For now, we are not rushing, as the breakdown has not yet happened but we are seeing great chances for it so we are looking for further movement to lower zones and a breakdown to happen, which then would give us a good opportunity for a 33% drop!
Swallow Academy

#FLOKI/USDT#FLOKI
The price is moving within a descending channel on the 1-hour frame and is expected to break and continue upward.
We have a trend to stabilize above the 100 moving average once again.
We have a downtrend on the RSI indicator, which supports the upward move by breaking it upward.
We have a support area at the lower limit of the channel at 0.00007790, acting as strong support from which the price can rebound.
Entry price: 0.00007875
First target: 0.00008000
Second target: 0.00008133
Third target: 0.00008300

FLOKI Correction done?The Price has reached Weekly1 support and a lot of stop-losses have been liquiditated(orange lines). There is one more major insufficient area FVG3 (Fair Value Gap) remaining and some stop-losses to take out around 0.00006568 price. This is very high probability buy-side liquidity area providing very good entry point inside FVG3. The price might also bounce from the current levels without visiting these lower levels but I personally would feel a lot safer with a liquidity sweep bounce from a FVG. Current ~44% correction from the previous highs is decent but further correction into the FVG3 levels would bring it to ~50% beeing not that uncommon scenario with alts. Either way, the direction is up. Way UP!

BuyWe reach a demand zone and then break last lower high and then pullback to the area and then we enter.

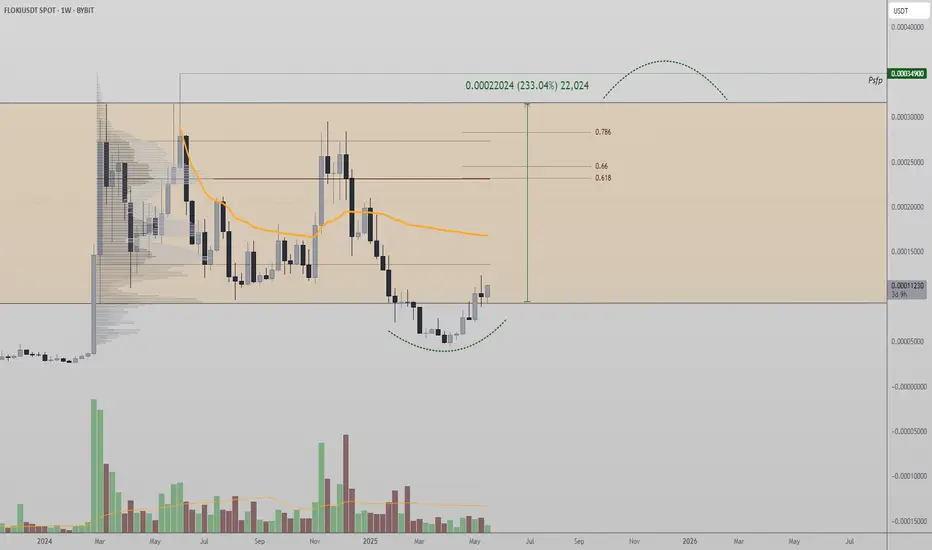
Technical Analysis – FLOKI/USDT (1W Chart
🔍 Key Technical Overview:
FLOKI has recently broken above a long-term descending trendline, signaling a potential major reversal.
The price is forming a rounded bottom pattern, indicating accumulation and a potential bullish breakout.
📈 Bullish Price Targets:
First Target: 0.00017419 USDT
↳ Based on prior structure and Fibonacci 1.0 projection.
Second Target: 0.00026197 USDT
↳ Full measured move from the rounded bottom breakout and historical resistance zone.
🧠 Technical Notes:
Fibonacci Retracement Levels show the current price hovering near the 0.382–0.5 zone, which often precedes a strong breakout.
Bullish projections (gray candles) highlight a parabolic move possibility.
✅ Strategic Outlook:
Buy Zone: Above 0.00009000 (confirmed breakout with volume)
Take Profits:
TP1: 0.000174
TP2: 0.000262
Stop Loss: Below 0.000065 (to protect against false breakout)
📌 Summary:
FLOKI is showing strong bullish momentum with a clear breakout from a long-term downtrend. A continuation toward 0.00017 and potentially 0.00026 is likely if momentum persists.

FLOKI Technical Outlook: Trend, Patterns, and Trade PlanFloki (FLOKI) continues to demonstrate robust bullish momentum on the higher timeframes, with price action respecting the prevailing uptrend 📈. After continued retracements and expansion, the structure remains constructive, and my directional bias is firmly bullish.
While the emergence of a three-drive pattern warrants some caution ⚠️, the overall trend suggests that any corrective move could present a high-probability long opportunity. Wait for a retrace to key support zones before considering entries. My targets are set at previous swing highs visible on the 4H chart, with stops placed just below the most recent low for prudent risk management.
As always, this is not financial advice—trade safe and stick to your plan! 🚀

FLOKI Correction Complete & Ready to Rally!📊 CRYPTO:FLOKIUSD found strong buying interest in the blue box area at $0.000083 - $0.000074, setting the stage for a trend continuation to the upside.
🚀 Will momentum push it toward new highs?

FLOKI/USDT – Final Sweep Before the Reversal? Watch These LevelsFLOKI has rebounded from a key Fibonacci level, but price action still sits in a high-stakes zone. One more move lower could complete a pattern that flips the script to bullish.
Key Highlights:
Price rejected from HTF resistance after bounce
0.618 Fibonacci offered strong short-term support
A liquidity sweep below recent lows could complete a bullish structure
FLOKI’s recent bounce off the 0.618 Fibonacci retracement was clean, but not yet convincing. After failing to break through high time frame resistance, price is now trading in compression, coiling between strong support and overhead resistance.
Technically, this kind of behavior often precedes a decisive move. One concern is the uncollected liquidity still resting just beneath the previous swing low. From a market structure standpoint, this opens the door to one more leg down—potentially into the same Fib zone—to flush weak hands and form a base.
This would complete what resembles a bullish three drives pattern, with each low sweeping liquidity more efficiently. If the third drive plays out and buyers step in aggressively, we could see a clean shift in structure—especially if price can break above the VWAP and reclaim the value area high.
Keep a close eye on the $0.618 zone. A final wick down into liquidity followed by strength could confirm a reversal and set the stage for FLOKI’s next breakout.

#FLOKI/USDT#FLOKI
The price is moving within a descending channel on the 1-hour frame and is expected to break and continue upward.
We have a trend to stabilize above the 100 moving average once again.
We have a downtrend on the RSI indicator, which supports the upward move by breaking it upward.
We have a support area at the lower limit of the channel at 0.00008150, acting as strong support from which the price can rebound.
Entry price: 0.00008490
First target: 0.00008713
Second target: 0.00008887
Third target: 0.00009129

FLOKIUSDT Forming Bullish waveFLOKIUSDT is currently showcasing a strong bullish setup, supported by growing volume and technical confirmation. The recent price movement indicates accumulation at key support levels, followed by a tightening range that often precedes a significant breakout. This structure suggests high probability for a powerful upward move, aligning with the projected 80% to 90% gain. With market sentiment turning positive around meme tokens and community-driven coins, FLOKI is positioned for potential explosive growth.
The FLOKI project continues to capture attention across crypto communities due to its expanding ecosystem, including FlokiFi, NFT integrations, and utility within the DeFi space. This has helped build confidence among investors, especially as FLOKI has transitioned from a meme coin narrative to one with real-world use cases. As volume builds around this consolidation, technical traders may interpret this as a bullish continuation pattern, setting the stage for aggressive price expansion.
Technically, FLOKIUSDT is attempting a breakout from a downward channel, with recent candles showing strong rejection of lower prices and momentum starting to shift upward. Once this breakout is confirmed with sustained volume, the rally could accelerate quickly, as price targets move into the 0.000015–0.000016 range. This aligns with the 80–90% gain expectation highlighted on the chart, providing a favorable setup for swing and position traders alike.
Overall, FLOKIUSDT offers a compelling combination of bullish technicals, increasing investor interest, and narrative momentum. It’s a chart worth watching closely for breakout confirmation, especially for those looking to capitalize on mid-cap altcoin volatility during this phase of the market cycle.
✅ Show your support by hitting the like button and
✅ Leaving a comment below! (What is You opinion about this Coin)
Your feedback and engagement keep me inspired to share more insightful market analysis with you!

FLOKIUSDT 1D AnalysisFLOKI ~ 1D Analysis
#FLOKI Buy back from here with a short term target of at least 15%+ and a long term target of $0.00028

Updated Analysis According to Current Market ConditionsFLOKIUSDT: Monitoring the Blue Box Support Areas
In this analysis, the blue boxes are identified as potential support areas where buying pressure could develop. While the market sentiment is currently unfavorable, the price has revisited my previously marked blue boxes. Based on this, I have chosen to add to my positions, confident in the structural importance of these zones.
Trading Strategy
Lower Time Frame Reactions: It's critical to observe how the price reacts within these blue box zones. Signals such as bullish candlestick formations, increased volume, or divergence patterns could indicate a reversal opportunity.
Long Trade Setups: Trades can be structured by leveraging these lower time frame confirmations, ensuring a clear entry and exit strategy aligned with market conditions.
Summary
Despite the broader market looking weak, the blue boxes in FLOKIUSDT offer potential support and a chance to position for a bounce. By focusing on reactions in these zones, traders can adjust their strategies to the prevailing conditions while managing risk effectively.
I keep my charts clean and simple because I believe clarity leads to better decisions.
My approach is built on years of experience and a solid track record. I don’t claim to know it all, but I’m confident in my ability to spot high-probability setups.
My Previous Analysis
🐶 DOGEUSDT.P: Next Move
🎨 RENDERUSDT.P: Opportunity of the Month
💎 ETHUSDT.P: Where to Retrace
🟢 BNBUSDT.P: Potential Surge
📊 BTC Dominance: Reaction Zone
🌊 WAVESUSDT.P: Demand Zone Potential
🟣 UNIUSDT.P: Long-Term Trade
🔵 XRPUSDT.P: Entry Zones
🔗 LINKUSDT.P: Follow The River
📈 BTCUSDT.P: Two Key Demand Zones
🟩 POLUSDT: Bullish Momentum
🌟 PENDLEUSDT.P: Where Opportunity Meets Precision
🔥 BTCUSDT.P: Liquidation of Highly Leveraged Longs
🌊 SOLUSDT.P: SOL's Dip - Your Opportunity
🐸 1000PEPEUSDT.P: Prime Bounce Zone Unlocked
🚀 ETHUSDT.P: Set to Explode - Don't Miss This Game Changer
🤖 IQUSDT: Smart Plan
⚡️ PONDUSDT: A Trade Not Taken Is Better Than a Losing One
💼 STMXUSDT: 2 Buying Areas
🐢 TURBOUSDT: Buy Zones and Buyer Presence
🌍 ICPUSDT.P: Massive Upside Potential | Check the Trade Update For Seeing Results
🟠 IDEXUSDT: Spot Buy Area | %26 Profit if You Trade with MSB
📌 USUALUSDT: Buyers Are Active + %70 Profit in Total

FlokiCoin Technical Analysis – Buy the Dip OpportunityFlokiCoin is currently trading at a critical support region, aligning with both structural support and the 200-period exponential moving average (EMA). This area marks a key inflection point for price action, as it has historically acted as a springboard for bullish continuation. The confluence of the 200 EMA and the channel low support significantly increases the importance of this level, as it represents a major decision point for market participants.
Despite the recent corrective move, the broader market structure remains bullish. Price action has been consistently printing higher highs and higher lows over the past several weeks, a hallmark of an established uptrend. The recent bounce from this confluence support zone can be considered another higher low in this bullish sequence, suggesting that the pullback may have already found its base.
A successful retest of this area has already occurred, leading to a rebound that reinforces the idea of ongoing buyer interest. If price continues to hold above this zone, it increases the probability of FlokiCoin resuming its upward trajectory. The key target from here is the channel high resistance, which is located at 1,478 satoshis. This level serves as the primary objective for bullish momentum, and a break above it could open the door for a stronger expansion move.
In conclusion, as long as price holds above the current support confluence, this pullback can be interpreted as a buying opportunity within the context of the existing trend. FlokiCoin remains in a bullish posture technically, and the current setup favors a continuation to the upside toward higher levels.

Very soon it will break the last existing high.Through my analysis and based on Elliott Waves, I found that Bitcoin is currently in the fifth and final wave according to Elliott Waves, which will lead to the formation of a new peak for Bitcoin.

#FLOKIUSDT (weekly )The weekly overview shows red resistance lines and a red ceiling resistance band.

FLOKIUSDT IDEAFloki has fallen behind touching the next resistence like the other coins , it believe it will follow the pattern

FLOKI/USDT – Bullish Deviation Reclaim Could Trigger ExpansionFlokiCoin has shown notable strength with a 10% move to the upside, now reclaiming a major high-timeframe range low. This price action hints at a confirmed bullish deviation, suggesting further upside potential if key levels are cleared.
Key Highlights:
Bullish deviation confirmed above the reclaimed range low
Value Area Low (VAL) is the next resistance that must break
Point of Control (POC) and 0.618 Fib are aligned for next upside target
FlokiCoin’s recent 10% surge has flipped a critical level — the range low on the higher timeframe — back into support. This kind of reclaim, especially after a deviation or “failed auction” beneath a key level, often signals a bullish reversal. When price dips below a level only to reclaim it with strength, the setup typically draws price back toward the other side of the range where liquidity is resting — in this case, the range high.
Currently, the next immediate challenge is the Value Area Low, a key resistance that must break cleanly. A successful breach of this area would open the path to the Point of Control, which interestingly aligns with the 0.618 Fibonacci retracement — offering a double confluence zone for a possible stall or further breakout.
Price may consolidate between these levels in the short term, forming a tighter range. However, from a structural perspective, the momentum is leaning bullish, and the objective remains the range high resistance, which has yet to be tested.
Buy Idea Bitcoin hitting ATH should fuel other crypto coins run.
On this daily chart, I'm observing this coin here.
Floki maybe?I myself sketch this scenario and I also think that we have not yet seen much of an increase in this altcoin.

FLOKIUSDT 1D#FLOKI has broken above the Descending Broadening Wedge and formed a Rising Wedge pattern, which is typically bearish. However, it has bounced from the support zone and the Rising Wedge support. We remain bullish. Will buy here and at laddered supports: $0.00009300, $0.00008710, $0.00007652
Targets:
🎯 $0.00013134
🎯 $0.00015678
🎯 $0.00018221
🎯 $0.00021841
🎯 $0.00026453
⚠️ Use a tight stop-loss.

FLOKI AT RESISTANCE LINElooks like price will drop lower from here. Trade with caution!
Please support this idea with a LIKE👍 if you find it useful🥳
Happy Trading💰🥳🤗
