Floki (FLOKI): Good Buying Opportunity After Break of StructureFloki coin has good potential after the recent BOS, which is followed by a sharp bullish trend. There are 2 styles too long in this situation so we shared both of them. Either way, there is a good chance to get 2x on this coin!
More in-depth info is in the video—enjoy!
Swallow Academy
FLOKIUSDT trade ideas

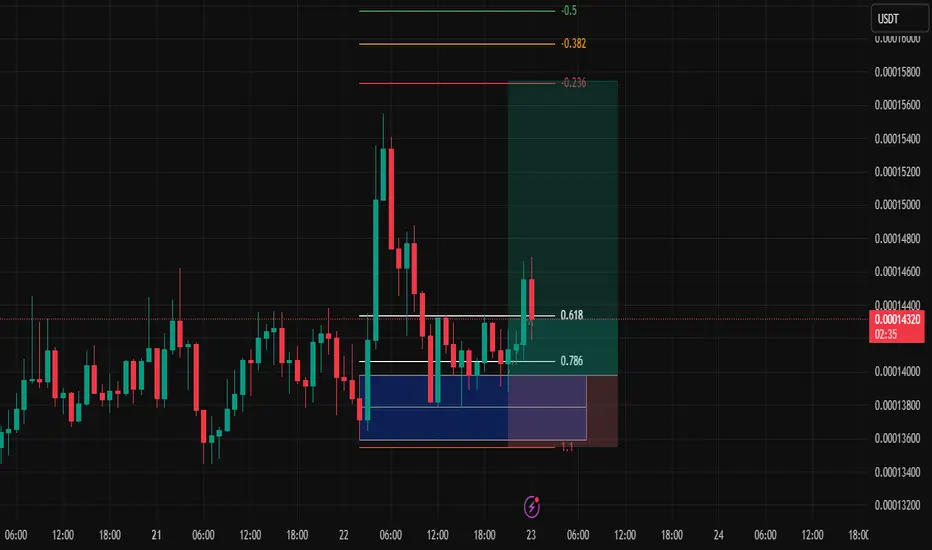
Consistency: The Pursuit of Happiness – Week 2, Trade #4📘 Week 2 – Trade #4
Strategy Journal | Futures Account**
Asset: \ BINANCE:FLOKIUSDT
Timeframe**: 1H
Entry Type**: Order Block (below the 0.786)
---
🧭 Context
This is Day 4 of my live journaling and strategy publishing process.
Normally, I don’t trade on Mondays or weekends—but recent schedule shifts had me checking the charts over the weekend and saw some SPOT trades to take on Monday. That work took up a lot of mental capital heading into Tuesday. Still, I wanted to stay consistent in the process, even if energy wasn’t fully focused on the charts.
Trade Setup & Strategy
I’ve been sitting in cash for a while. Today, I wasn’t actively hunting setups—I was waiting for one to come into my criteria , and this one did.
The asset: \ BINANCE:FLOKIUSDT
My usual entries are around the 0.618 retracement , but this time, I adjusted based on my internal bandwidth and risk sensitivity.
Instead, I entered below the 0.786 , directly on the order block.
Why?
Because when my mind isn’t 100% on the charts, I don’t want to overexpose myself. Order block entries reduce my stop size and allow for better risk-to-reward profiles. It’s a cleaner, more defensive entry compared to FVGs or mid-OTE zones.
So yes—I’ve gone a little off script from my usual 0.618 entries, but not outside the logic of the framework. It’s a tweak based on context and mental clarity.
📊 Market Structure & Bias
I’m looking for a run of the previous day’s high.
But here’s the wrinkle: that high is a Monday high. And Monday’s range often gets targeted later in the week, so there’s potential—but no guarantees.
London PM session consolidated.
NY AM lacked strong momentum.
That leaves NY PM or Wednesday Asia/NY as potential breakout windows.
I’m letting it run, no interference.
🔍 Risk, Entry, and Strategy Notes
Entry: Order Block, below 0.786
Bias: Take out previous day’s high
Timeframe: 1H
Stop: Tighter than my usual 0.618 entries
Mental Capital: Split between trading futures and Spot
Objective: Stay consistent with journaling and process
Trade Management: No touch. Let it do what it does.
📌 Reflections
This is a good representation of adapting the strategy without breaking it. Fewer trades, less risk, more focus—and ideally, cleaner results.
This also confirms something I’ve been leaning into:
> **I'd rather take fewer, higher-conviction trades at cleaner levels.**
Let’s see if this one plays out. Win or loss, the goal remains the same:
Consistency → Clarity → Repeatability.
---
Result to be published once the trade concludes.
This journal remains part of a longer strategy documentation series.
Ready For Floki’s 30 Percent Surge? Main Target 0.00017Hello✌
Let’s analyze Floki’s upcoming price potential 📈.
BINANCE:FLOKIUSDT has confidently broken through its recent resistance levels 🚀, signaling strong upward momentum. Aiming for at least a 30% gain, the main target is set around 0.00017. Keep an eye on this level as it could offer a solid opportunity for those ready to ride the next wave 📈.
✨ Need a little love!
We pour love into every post your support keeps us inspired! 💛 Don’t be shy, we’d love to hear from you on comments. Big thanks , Mad Whale 🐋

FLOKIUSDT Pullback at Fibonacci Resistance – Bounce?📊 Market Overview:
FLOKI has recently posted a remarkable rally, gaining over +200% from the swing low at 0.00004548. This surge broke through multiple resistance levels, forming a strong bullish market structure with clear Higher Highs (HH) and Higher Lows (HL).
However, this bullish momentum has now met a critical resistance at 0.00015339, which aligns with the Fibonacci 0.382 retracement level of the previous macro move. This rejection has triggered a pullback, raising questions: is this a healthy retracement, or the start of a trend reversal?
---
🧠 Technical Breakdown:
✅ Bullish Structure in Play
The recent move appears to be part of a larger impulsive wave, possibly Wave 1 or 3 of an Elliott Wave sequence.
✅ Golden Pocket Zone in Sight
The highlighted yellow box marks the Fibonacci Golden Pocket area between 0.5 (0.00011441) and 0.618 (0.0001104) — historically, this is a high-probability buy zone where bulls often regain control.
✅ Breakout Retest Potential
The current pullback could be a textbook retest of the previous breakout base, setting up for continuation — but only if this key zone holds.
---
🟢 Bullish Scenario:
If the price finds support at the 0.000110–0.000114 zone, and forms a strong bullish reversal candle (e.g., bullish engulfing, hammer), it could ignite a fresh wave upward targeting:
🔼 0.00015339 (breakout level)
🔼 0.00018212
🔼 0.00020366
🔼 0.00022000
🔼 0.00026506
🏁 0.00028898 — the previous major high and full swing target
Such a move would validate the continuation of the macro uptrend and possibly confirm Wave 3 in a larger Elliott Wave structure.
---
🔴 Bearish Scenario:
On the other hand, a daily close below 0.000110 would invalidate the bullish golden pocket thesis and potentially shift momentum in favor of the bears.
Possible downside targets include:
🔻 0.00008500 — minor support and demand zone
🔻 0.00004548 — the macro low and strong historical support
This would form a Lower High (LH) structure, which could signal the beginning of a bearish trend or extended consolidation.
---
🔍 Conclusion:
> FLOKIUSDT is now at a make-or-break level. The 0.000110–0.000114 zone is where bulls and bears will battle for control of the trend.
Hold here — and we may see a strong continuation.
Break below — and caution is warranted.
Wait for clear price action confirmation in the coming sessions before positioning. This zone will likely dictate FLOKI’s next major move.
---
💡 Pro Tips for Traders:
Watch for bullish reversal candlesticks in the golden pocket area.
Monitor volume — rising volume on a bounce increases breakout probability.
RSI divergence may provide early signs of trend reversal or continuation.
#FLOKIUSDT #FLOKI #CryptoAnalysis #AltcoinRally #FibonacciLevels #TechnicalAnalysis #BullishScenario #BearishScenario #PriceAction #CryptoBreakout #GoldenPocket #TrendReversal

APA!? Always Plan Ahead! Are you ready!?Which number will play? 🤔
Swift price action makes the chart light up. It grabs your attention, makes it feel like something big is happening. And often it is. But sometimes, those sharp moves stall out just as quickly as they started.
That’s why we Always Plan Ahead.
Some alts gave us a clean #ElliottWave anchor. Structurally, it looks like a potential wave 3. Strong momentum, hitting projection zones, and solid separation from prior corrections at the smaller degree. Exactly what you want to see.
But fast doesn’t always mean forward.
Without a proper follow-through or a complete structure, one wave doesn’t tell the whole story. That’s why it’s key to wait for the next pieces to print. A wave 3 might be in play, but we still need confirmation—whether it unfolds into a 5-wave impulse, stalls into a correction, or pivots entirely.
The chart shows a few possibilities.
1 A swift move that didn’t lead to continuation.
2 A Zig Zag that completing.
3 A better-looking impulse with space between the corrective moves.
4 An impulse that completes but sets us up for a 2nd entry
The question now:
Which number will play? … or something else entirely?
That’s where planning comes in. You don’t need to know the outcome to be ready for it.
Stay sharp. Stay patient. And most of all—
Always Plan Ahead.

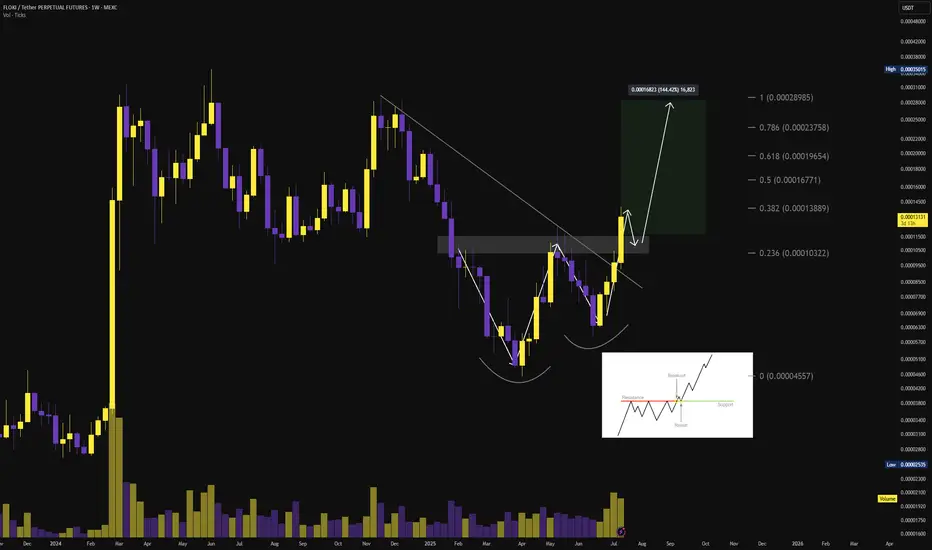
$FLOKI | Dual Reversal Structure Detected SEED_DONKEYDAN_MARKET_CAP:FLOKI has executed a high-conviction breakout from a converging double bottom + inverse head & shoulders formation — both classic bullish reversal patterns.📊🔥
💥 Technical Breakdown:
• Double bottom with neckline break confirms demand zone absorption
• Breakout with retest and expanding volume = institutional-grade confirmation
• Target zones aligned with Fibonacci extensions and prior HVN zones
🎯 Fib Extension Targets:
→ 0.0001965 (0.618)
→ 0.0002375 (0.786)
→ 0.0002898 (full measured move)
📈 Structure + volume = conviction. This is how trend reversals are born.
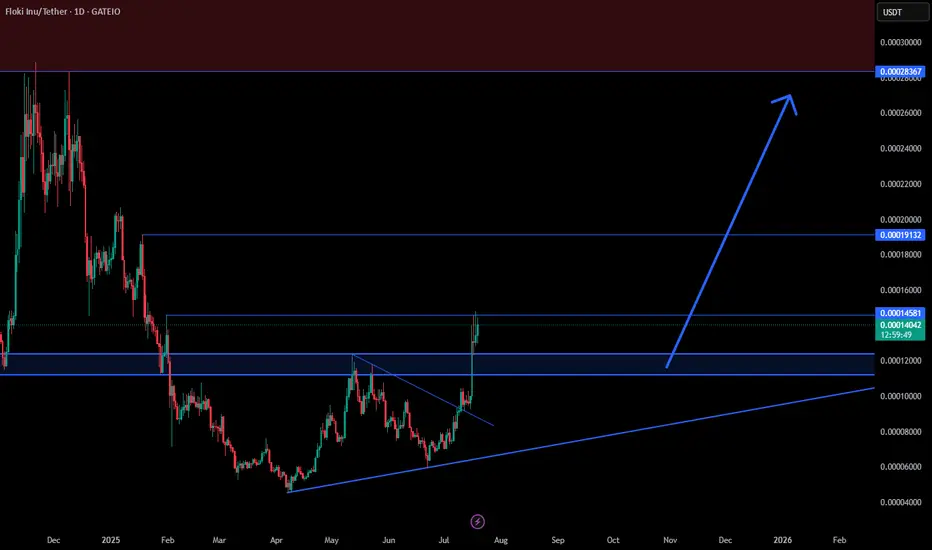
FLOKI Ready for a Big Move !📊 FLOKI/USDT Analysis
Floki just broke out of a falling wedge and flipped key resistance around 0.00012 into support. As long as price holds above this zone, I’m targeting the next major resistance levels at 0.00019 and 0.00028.
✅ Bullish market structure with strong momentum.
✅ Potential for a big move if current breakout holds.
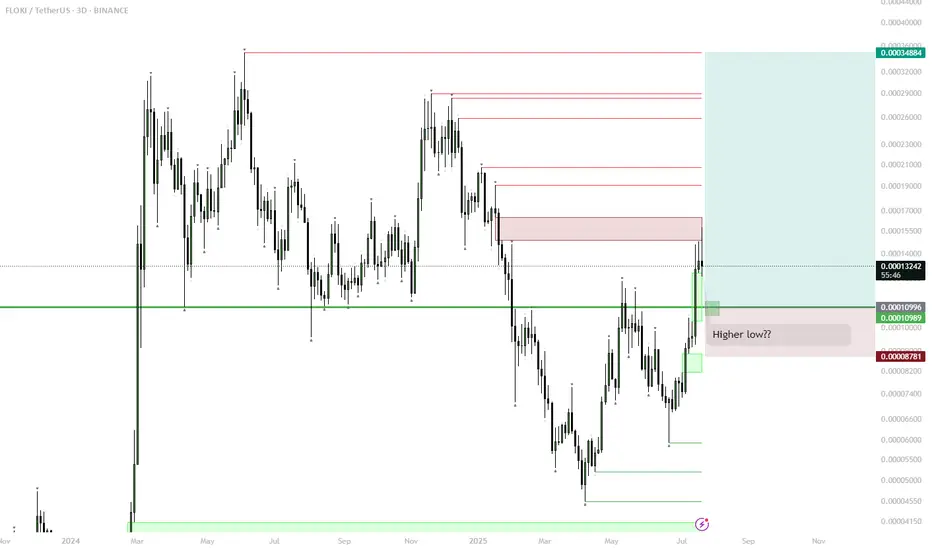
FLOKI – Range Low Setup for Next Big Move? (1D Plan)
FLOKI has reclaimed the key horizontal support, forming a possible higher low.
Currently watching the green box/range low for signs of accumulation (sideways price action) and support confirmation.
If FLOKI establishes a range or shows strength at this zone, look for a long entry with stop below the range.
Upside target is the range high and previous major resistance, offering a potential ~180% move.
Invalidation: clear breakdown and close below the green zone signals failed setup.
FLOKI is showing classic bottoming structure: reclaim of support and formation of a higher low after a prolonged downtrend. Range lows historically have provided major entries for explosive moves. If the green box zone acts as accumulation and price holds, it could set the stage for a rally back to the top of the range as seen before. This setup is favored in meme/altcoin cycles, especially when market sentiment improves. Risk is defined, reward is high.
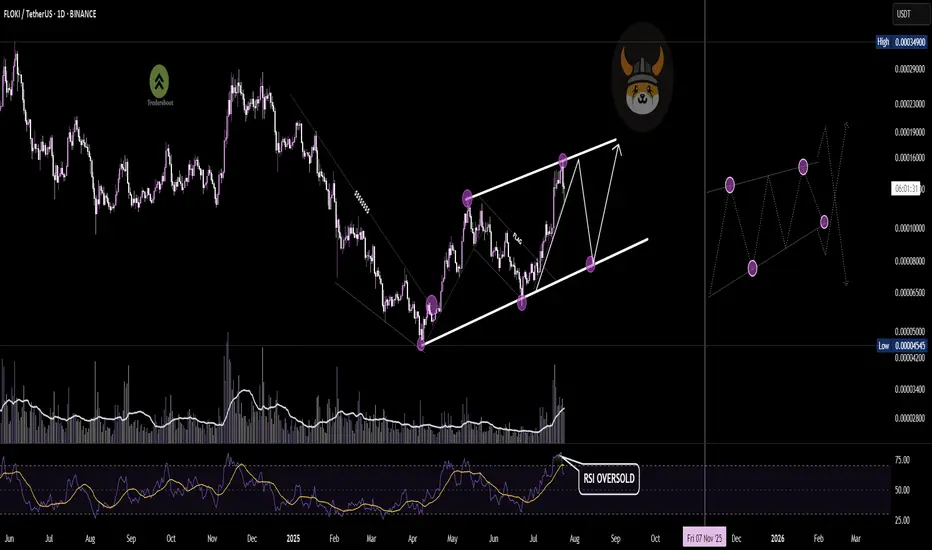
FLOKI respecting the channel beautifullyFLOKI/USDT on the daily chart is forming a well-defined ascending channel, respecting both upper resistance and lower support trendlines.
The RSI recently entered the overbought zone near resistance, suggesting short-term exhaustion. If price corrects, we could see a move toward the lower trendline, offering a potential long opportunity for another leg higher — keeping the bullish structure intact.
FLOKI | Reclaim of Trading ZoneFLOKI is showing a strong bullish reversal pattern as it reclaims the critical trading zone.
Key Technical Signals:
Clean breakout from descending wedge formation
RSI showing bullish divergence and momentum shift
Price reclaiming major support zone as new resistance turns support
Volume supporting the upward move
Entry Strategy:
Retest of the trading range low around 0.000012
Risk Factors:
Bitcoin's overall market direction could impact this altcoin move. A failure to hold above the green support zone would invalidate the bullish thesis.

Buy Trade Strategy for FLOKI: Tapping Into Memecoin UtilityDescription:
This trading idea is centered on FLOKI, a cryptocurrency that originated as a memecoin but has evolved into a broader ecosystem project with real-world utility. Backed by a vibrant community and inspired by Elon Musk’s Shiba Inu, FLOKI aims to differentiate itself through initiatives such as Floki University (crypto education), Valhalla (an NFT metaverse game), and strategic charity partnerships. The project's growing utility and branding strength position it as a serious contender among memecoins shifting toward tangible use cases.
Despite its promising development roadmap, FLOKI remains a high-risk asset due to its origins in speculative hype and the unpredictable nature of retail-driven trends. External factors like market sentiment, regulatory scrutiny, and overall crypto market conditions can strongly influence its price action. Investors should exercise caution and apply disciplined risk management when considering exposure to FLOKI.
Disclaimer:
This trading idea is for educational purposes only and does not constitute financial advice. Cryptocurrencies like FLOKI are highly speculative and involve substantial risks, including the complete loss of capital. Always conduct independent research, consider your financial situation, and consult a licensed financial advisor before making any investment decisions. Past performance is not indicative of future results.
FLOKI: The optimal entry price! Trading Setup
If you’re considering trading FLOKI, here’s a quick setup that may help you.
The idea is: Buy when the price breaks above $0.000105 and take profits at the levels shown in the chart.
Targets:
1. $0.000108
2. $0.000112
3. $0.000117
-------------------------------------------
About our trades:
Our success rate is notably high, with 10 out of 11 posted trade setups achieving at least their first target upon a breakout price breach (The most on TW!). Our TradingView page serves as a testament to this claim, and we invite you to verify it!

Floki Eyes Explosive 18% Rally Toward 0.00010 Resistance LevelHello✌
All previous targets were nailed ✅! Now, let’s dive into a full analysis of the upcoming price potential for Floki 🔍📈.
BINANCE:FLOKIUSDT has recently stabilized within a newly developed ascending channel following a series of sharp pullbacks. Price is currently hovering near a significant daily support zone, which may serve as a strong base for a potential bullish reaction. I’m watching for an upward move of around 18%, with a short-term target at 0.00010. 📊🚀
✨ Need a little love!
We pour love into every post your support keeps us inspired! 💛 Don’t be shy, we’d love to hear from you on comments. Big thanks , Mad Whale 🐋

Floki (FLOKI): Looking For Buy Entry | Aiming For +22%Floki has been in a healthy bullish trend here after buyers overtook the zone of EMAs. With current momentum on markets, we might see a proper breakout from the local resistance area, which is marked as our entry as well.
As soon as we see a breakdown there, we are going to go into a long position, but keep in mind—there is a huge bearish CME gap that we have to pay attention to, as if we see any strong sell-off, then this would be our target for short.
Swallow Academy

$FLOKI Weekly Breakout Alert!SEED_DONKEYDAN_MARKET_CAP:FLOKI Weekly Breakout Alert!
Price just broke a major downtrend on the weekly chart 📈
Accumulation rising, exchange reserves at 10-month low.
Valhalla mainnet is live—real utility kicking in.
This could be the start of a big pump. Targets: $0.0003 → $0.0006
#FLOKI #MemeCoin

#FLOKI/USDT#FLOKI
The price is moving within a descending channel on the 1-hour frame and is expected to break and continue upward.
We have a trend to stabilize above the 100 moving average once again.
We have a downtrend on the RSI indicator, which supports the upward move by breaking it upward.
We have a support area at the lower limit of the channel at 0.00008150, acting as strong support from which the price can rebound.
Entry price: 0.00008490
First target: 0.00008713
Second target: 0.00008887
Third target: 0.00009129

#FLOKI/USDT#FLOKI
The price is moving within a descending channel on the 1-hour frame and is expected to break and continue upward.
We have a trend to stabilize above the 100 moving average once again.
We have a downtrend on the RSI indicator, which supports the upward move by breaking it upward.
We have a support area at the lower limit of the channel at 0.00007790, acting as strong support from which the price can rebound.
Entry price: 0.00007875
First target: 0.00008000
Second target: 0.00008133
Third target: 0.00008300

FLOKI/USDT — Major Breakout Incoming? The Calm Before a BullishThe daily chart of FLOKI/USDT reveals a highly compelling technical setup. After a prolonged downtrend that started in late 2024, FLOKI is now testing a key descending trendline — signaling a potential trend reversal and the beginning of a new bullish phase if a breakout is confirmed.
📊 Detailed Technical Analysis:
🔍 Pattern Formation:
Descending Trendline Resistance: Acting as a dynamic resistance since the November 2024 high, capping every major rally attempt.
Consistent Higher Lows: Since March 2025, FLOKI has been forming a series of higher lows — an early bullish sign of accumulation.
Volatility Squeeze: Recent candles are consolidating near the apex of the triangle, suggesting a breakout move is imminent.
Bullish Structure Forming: A successful breakout would complete a bullish reversal pattern on the daily chart.
🟢 Bullish Scenario (Breakout Confirmation):
If the price closes above 0.0001079 on the daily timeframe and confirms a clean breakout above the descending trendline, we can anticipate an extended move to the upside.
🎯 Key upside targets based on historical resistance zones:
1. Target 1: 0.00011535 → Previous minor resistance
2. Target 2: 0.00013414 → March 2025 supply zone
3. Target 3: 0.00016078 → Strong horizontal resistance
4. Target 4: 0.00020000 → Major psychological level
5. Target 5: 0.00028779 → Previous swing high (November 2024)
💥 A full breakout move to the top could offer over 200% potential upside, making it a high-reward setup for well-managed long entries.
🔴 Bearish Scenario (Rejection):
If FLOKI fails to break above the descending trendline:
⚠️ We could see a retracement to lower support levels:
Minor Support: 0.00007500
Key Support: 0.00005700
Last Defense: 0.00004548 → Previous cycle low
A breakdown below these support levels would invalidate the bullish setup and shift momentum back in favor of the bears.
🧠 Pro Tips:
Watch for Volume Confirmation during the breakout — high volume adds credibility.
Focus on Body Closes, not just wicks, when identifying valid breakouts.
Manage Risk Wisely — a stop loss just below the trendline offers solid risk-to-reward.
📅 Conclusion:
FLOKI/USDT is at a critical technical juncture. A confirmed breakout above the descending trendline could spark a strong bullish trend, while a rejection may lead to deeper correction or consolidation.
💡 The next few candles will likely determine the medium-term direction for FLOKI.
#FLOKI #FLOKIUSDT #AltcoinBreakout #CryptoSetup #TechnicalAnalysis #BullishCrypto #BreakoutTrade #TrendReversal #CryptoSignals

Floki Inu Bullish Signal Fully Confirmed (486% Easy Potential)The last time FLOKIUSDT moved above EMA55 daily, it produced a bullish wave exceeding 1,250% profits, within months. This same signal, the same development is happening now after years of bearish action and months of consolidation. In short, a very strong bullish reversal signal is now present on the chart.
To be honest, that's all there is. More information can just get things confused but, let's proceed.
The downtrend ends and we enter a transition period.
The transition is over and we enter an uptrend. That's all there is. Floki Inu is set to grow.
The bullish bias is already confirmed. As FLOKI now trades above EMA55, trading volume continues to increase. The chart structure is also perfect for a bullish wave. The last major low is still a long-term higher low compared to the bottom prices before the 2024 bullish wave.
Unlike in the past, there is no need to wait for months for this jump to come to be. Floki will start moving within weeks, maximum. It is possible that the next bullish wave goes into full force within days. The entire altcoins market has been consolidating long enough. The time is now.
Thanks a lot for your continued support.
Namaste.

$FLOKI/USDT Breakout Reloading.SEED_DONKEYDAN_MARKET_CAP:FLOKI is holding strong above the breakout zone after retesting key support.
As long as it stays above, the setup looks bullish with a potential upside toward 0.00010800 (+27%).
The structure remains solid, eyes on the next breakout move.
DYOR, NFA

FLOKIUSDT Forming Descending ChannelFLOKIUSDT is attracting serious attention as it breaks out of a clear downward channel, showing strong signs of a potential reversal with significant upside. The recent price action indicates that FLOKI has overcome key resistance within the descending channel, hinting at a trend shift supported by increasing trading volume. This renewed buying pressure suggests that investors are positioning themselves for what could be an impressive move upward.
Currently, FLOKIUSDT is poised to target gains of 70% to 80%+, making it one of the meme coins with a strong technical structure to watch closely. The breakout setup aligns with historical patterns where meme coins like FLOKI experience rapid surges once investor sentiment flips bullish. With growing community interest and positive social sentiment, FLOKI could ride this wave and reach new short-term highs if momentum continues to build.
For traders looking to capitalize on trending meme coins with solid chart setups, FLOKIUSDT offers an appealing risk-to-reward ratio. Key price levels to watch include maintaining support above the breakout point and confirming higher lows on the daily timeframe. Keeping an eye on volume spikes and community updates will be crucial in managing entries and exits during this anticipated uptrend.
✅ Show your support by hitting the like button and
✅ Leaving a comment below! (What is You opinion about this Coin)
Your feedback and engagement keep me inspired to share more insightful market analysis with you!

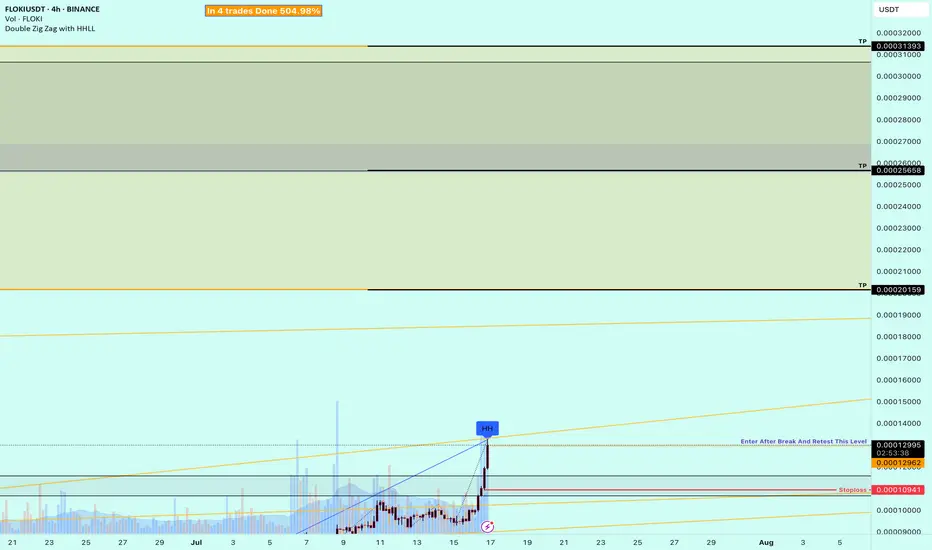
$FLOKI Breakout Ahead?SEED_DONKEYDAN_MARKET_CAP:FLOKI has broken out of a rising wedge on the 4H chart and is now retesting the breakout zone.
If this support holds, a move toward 0.00010200 is likely to offer up to 23% upside.
DYRO, NFA

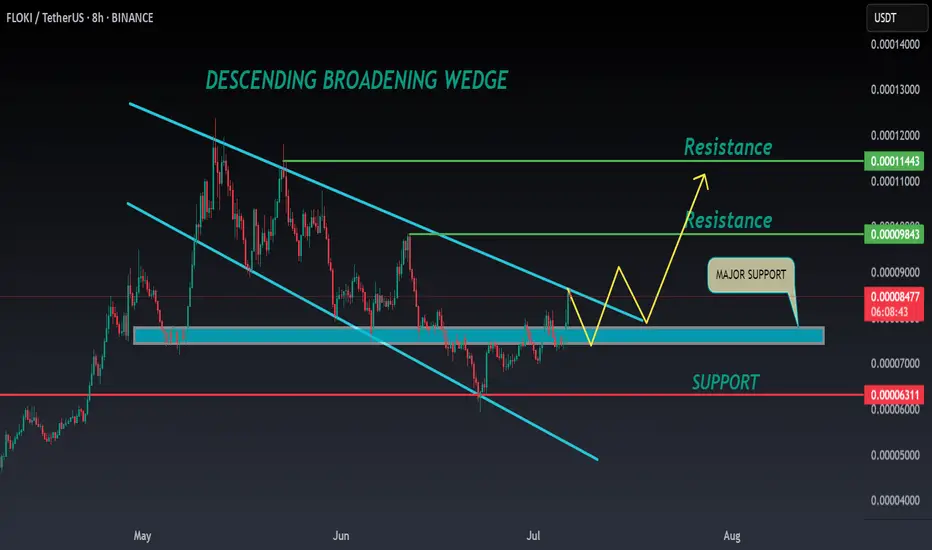
FLOKI ANALYSIS🔮 #FLOKI Analysis 🚀🚀
💲💲 #FLOKI was trading in a Descending Broadening Wedge Pattern, and trying to breakout the pattern. Also there is a instant support zone and after the breakout of resistance zone we will see a bullish move. 📈📈
💸Current Price -- $0.00008540
📈Target Price -- $0.00009840
⁉️ What to do?
- We have marked crucial levels in the chart . We can trade according to the chart and make some profits. 🚀💸
#FLOKI #Cryptocurrency #Breakout #DYOR