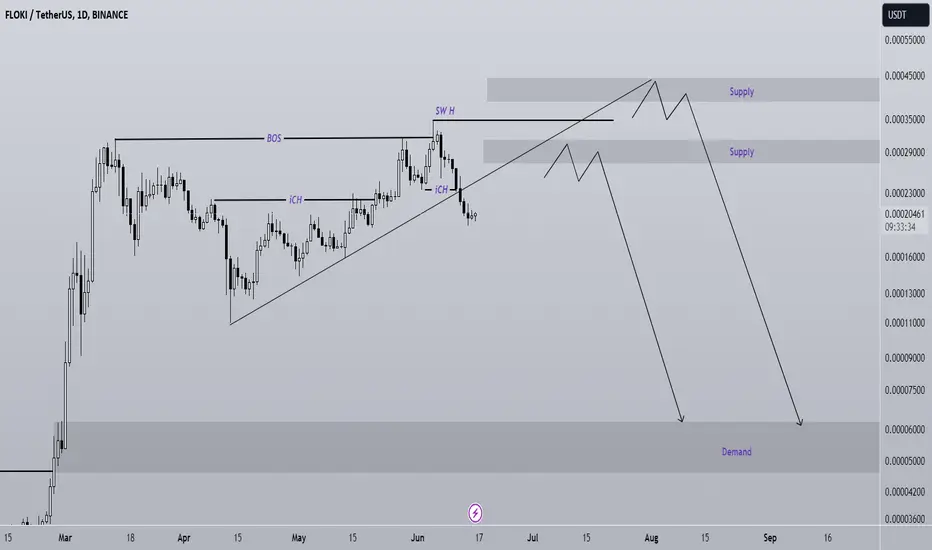
FLOKI analysisAfter the bearish iCH in the internal structure, the price has created an internal pullback.
A trend line has also been broken, but the bullish momentum is very high. FLOKI's bearish trend is expected to be created from one of the two specified supplies.
By maintaining the resistance swap range, it can drop towards the targets.
The target can be demand at the bottom of the chart
Note that the financial market is risky, so:
Do not enter any position without confirmation and trigger.
Do not enter a position without setting a stop.
Do not enter a position without capital management.
When we reach the first TP, save some profit and try to move the stop continuously in the direction of your profit.
If you have any comments please post them, comments will help us improve our performance
Thanks
FLOKIUSDT trade ideas

FLOKI: A big bounce is coming!FLOKI has seen a rapid cool-off in the past few days, and a more significant bounce could be around the corner! If you're looking to trade FLOKI at the moment, here's a quick setup that you might find helpful!
The idea is: Buy when the price breaks above 0.0002533$ and take profits at the levels shown in the chart.
Targets:
1. 0.000265$
2. 0.000283$
3. 0.0003$
-------------------------------------------
About our trades:
Our success rate is notably high, with 10 out of 11 posted trade setups achieving at least their first target upon a breakout price breach (The most on TW!). Our TradingView page serves as a testament to this claim, and we invite you to verify it!

FLOKIUSDT.4HExamining the 4-hour chart for FLOKI/USDT offers a detailed glimpse into its current technical landscape, allowing for an informed analysis.
Price Action: FLOKI/USDT is currently trading at 0.00024018, showing a slight increase of 1.99%. The chart indicates a pattern of higher lows, which could be viewed as a bullish signal. However, the price is presently near the support level S1 at 0.00018637, which needs to hold to maintain the upward trajectory.
Resistance Levels: The immediate resistance level R1 at 0.00033719 appears to be a significant barrier from past price interactions. The upper resistance R2 is set along an upward trendline, suggesting that if the price breaks above R1, it may find dynamic resistance as it ascends along this line.
Support Levels: The noted support at S1 is crucial; a breach below this could signal a shift in market sentiment to bearish, potentially leading to further declines. The support levels are critical for determining where buyers repeatedly enter the market, stabilizing the price.
Moving Average Convergence Divergence (MACD): The MACD indicator is below the zero line, which traditionally suggests bearish momentum. However, the MACD line is converging towards the signal line, indicating that the downward momentum may be losing strength, and a potential bullish crossover could occur if the trend continues.
Relative Strength Index (RSI): The RSI stands at 37.22, which is close to the oversold territory (below 30). This suggests that there might be potential for a bullish reversal as the market perceives FLOKI as undervalued.
Conclusion:
The technical outlook for FLOKI/USDT suggests cautious optimism. The near-oversold RSI and the converging MACD indicate potential for a reversal, but the key will be whether the support at S1 holds. If the price sustains above S1 and experiences a bullish MACD crossover, there could be an opportunity to target R1 as the next resistance level. However, if S1 fails, the sentiment might turn bearish, leading to a further decline. Traders should consider setting stop-losses below S1 to manage risk while preparing for a possible ascent towards R1 if upward momentum gains confirmation through technical indicators.

Sniper Entry For $FLOKIWas stopped out of my previous entry but this should be a good price to get into the CRYPTOCAP:FLOKI train as the price should push higher from here. CPI news should restore bullish sentiments to the crypto space and we should see CRYPTOCAP:BTC try and break the $72k resistance.

FLOKIUSDT.1DAnalyzing the FLOKI/USDT daily chart, I can see that the price recently peaked at a resistance level marked as R1 and is now retracing. I have drawn a green upward trendline that has been supporting the price movement; however, the current price action suggests a potential test of this support.
If the support holds, I anticipate a rebound towards the R1 level and potentially a move higher to R2. The Moving Average Convergence Divergence (MACD) shows a negative divergence as the MACD line is below the signal line, suggesting bearish momentum in the short term. Additionally, the Relative Strength Index (RSI) is around 54, indicating neither overbought nor oversold conditions but nearing the median, which aligns with a possible consolidation or retracement phase.
Based on the technical indicators and recent price behavior, my conclusion is that the market might experience further downward pressure in the near term. However, the support level delineated by the trendline and the S2 support zone should be monitored closely. A break below these could confirm a bearish trend, while a rebound from them could lead to a recovery back towards R1. The key will be how the price reacts to the trendline in the coming days.

$FLOKI is only Meme Showing strengthHello everyone,
Scanned through all meme coins between CRYPTOCAP:SHIB FWB:PEPE $FLOKI and Floki shows best strength.
Checkout chart. 📈
Stop loss is your best friend and good luck 🙏

#FLOKI/USDT is trying to break the Diagonal Trendline in 1-Hour #FLOKI/USDT is trying to break the Diagonal Trendline in 1-Hour TF!
In case of breakdown/retest to long it. Wait for bullish momentum to open a long position. The local resistance level is PDH 0.000287.

FLOKIUSDTFLOKIUSDT is in strong bullish trend.
As the market is consistently printing new HHs and HLs.
currently the market is retracing a bit after last HH, which is 50% Fib retracement level and local support as well. if the market successfully sustain this buying confluence the next leg up could go for new HH.
What you guys think of this idea?

FLOKI is Ready To Push Higher!Hello TradingView Family / Fellow Traders. This is Richard, also known as theSignalyst.
📈 FLOKI has been overall bullish, trading within the rising wedge in orange.
Currently, FLOKI is undergoing a correction phase and it is currently approaching the lower bound of the wedge.
Moreover, it is retesting strong demand zone marked in gray.
🏹 Thus, the highlighted blue circle is a strong area to look for trend-following buy setups as it is the intersection of the gray demand zone and lower orange trendline acting as a non-horizontal support.
📚 As per my trading style:
As #FLOKI approaches the blue circle zone, I will be looking for bullish reversal setups (like a double bottom pattern, trendline break , and so on...)
📚 Always follow your trading plan regarding entry, risk management, and trade management.
Good luck!
All Strategies Are Good; If Managed Properly!
~Rich

Why My Storng Altcoins Don't Go Up?The cryptocurrency market has changed a lot recently, making it harder for individual altcoins to increase in value. Every day, many new altcoins are created , which spreads the available money and attention across more coins . Because of this, the liquidity (or the amount of money available for trading) is divided among many different coins. This makes it tough for any one altcoin to get enough investment to see a significant price increase.
Low-market-cap altcoins can quickly rise in value due to hype and speculative trading, but this often doesn't last long. Stronger projects with larger market caps usually grow more slowly because they need more consistent and substantial investment to see price increases. Quick pumps are less common with these stronger projects because their higher market cap makes sudden price spikes more difficult.
Futures trading also affects altcoin prices significantly. When many traders bet on the market going up or down, trading platforms may force liquidations to manage risks, causing big price swings. This leads to long periods where the price stays steady or only moves slightly, as the market adjusts. These reaccumulation phases can make it seem like altcoins aren't increasing in value, as the market takes time to stabilize before any significant growth can happen.
Happy learning !


Floki (FLOKI): Potential Leg Up? (wait for breakout)Floki coin maintains the bullish pressure despite the dumps on the BTC. We are looking for that neckline zone to be broken anytime soon and a movement for upper zones for new ATHs
Swallow Team

Floki (FLOKI): are we seeing retest after 80% gains? | 7.06FLOKI broke out of a bullish pattern a few weeks ago, and since then it has earned investors profits. If the trend continues, then it won’t be surprising to see the memecoin reaching new highs soon.
The analysis of the memecoin’s daily chart revealed that its MACD displayed a bullish upperhand in the market.
According to the Bollinger Bands, FLOKI’s price was testing well above its 20-day Simple Moving Average (SMA). However, the Chaikin Money Flow (CMF) turned bearish as it moved southward.
If the memecoin continues to shed its value over the coming days, then investors might witness it drop to $0.00025. This seemed to be the case, as liquidation would rise sharply at that level.
On the other hand, if FLOKI turns bullish, then its price might touch $0.00036 soon.
WHITEBIT:FLOKIUSDT

FLOKI: Keep an eye on this level!FLOKI has been on a great run lately, setting a new ATH at 0.000349$! Currently, the price is cooling off in a descending triangle pattern, and a break of this pattern will occur soon!
If you're looking to trade FLOKI at the moment, here's a quick setup that you might find helpful!
The idea is: Buy when the price breaks above 0.000324$ and take profits at the levels shown in the chart.
Targets:
1. 0.000328$
2. 0.000338$
3. 0.000349$
-------------------------------------------
About our trades:
Our success rate is notably high, with 10 out of 11 posted trade setups achieving at least their first target upon a breakout price breach (The most on TW!). Our TradingView page serves as a testament to this claim, and we invite you to verify it!

Entity enter the meme world ---- FLOKIMeme coins once again led the market last week. Awaiting a new narrative, traders enter the meme world. Yesterday, the famous market maker DWF Labs announced that it would invest US$12 million in meme coins.
Although DWF Labs has a rough behavior, institutions starting to invest in meme coins will bring about a more stable trend. Like the early days of the Big Bang, BTC was also a meme coin. The currently announced tokens include LADYS and FOLIKI, and there are still individual projects on the way. Judging from DWF Lab’s past cooperation, BONK may also be one of them. Of course, this is just our guess.
As a meme born at the same time as PEPE, the price of FLOKI broke through the historical high after the investment was announced, and it also led to the rise of TOKEN of its affiliated project TokenFi. TOKEN occupies a large proportion of DWF Labs’portfolio. It’s FLOKI instead of PEPE that also highlights DWF’s ambitions.
As a meme coin that has been listed on large exchanges, FLOKI already has enough influence. Capital flow and popularity are its main driving forces. As we said before when talking about other meme coins, the performance of our AI indicators on meme coins is as good as ever. At the daily level, the TSB indicator successively prompted BUY signals on February 20 and May 18, and then began a strong rise.
You can also use the TSB indicator on the 4h level, as shown in the chart, which can also help you gain profits from memes.
Introduction to indicators:
Trend Sentinel Barrier (TSB) is a trend indicator, using AI algorithm to calculate the cumulative trading volume of bulls and bears, identify trend direction and opportunities, and calculate short-term average cost in combination with changes of turnover ratio in multi-period trends, so as to grasp the profit from the trend more effectively without being cheated.
KDMM (KD Momentum Matrix) is not only a momentum indicator, but also a short-term indicator. It divides the movement of the candle into long and short term trends, as well as bullish and bearish momentum. It identifies the points where the bullish and bearish momentum increases and weakens, and effectively capture profits.
Disclaimer: Nothing in the script constitutes investment advice. The script objectively expounded the market situation and should not be construed as an offer to sell or an invitation to buy any cryptocurrencies.
Any decisions made based on the information contained in the script are your sole responsibility. Any investments made or to be made shall be with your independent analyses based on your financial situation and objectives.

FLOKI: Resistance BreakoutTrade setup : Price is in an Uptrend. Following a bullish breakout from Channel Down, price broke above $0.000316 resistance level, it's prior ATH. broke above ATH and resistance of $0.00031...going higher. How much higher? hard to tell what's the next resistance but using Fib Extension Levels are: $0.00034 (50%) $0.00036 (61.80%) $0.00039 (78.60%) $0.00044 (100%) $0.00056 (161.80%). MEMEs have been on fire, the big theme of this cycle.
Pattern : Resistance Breakout . Once a price breaks above a resistance zone, it signals that buyers have absorbed all the supply from sellers at this level and price can resume it's advance. Following a resistance breakout, the next closest resistance zone becomes a price target. Learn to trade key level breakouts in Lesson 7.
Trend : Short-term trend is Strong Up, Medium-term trend is Strong Up and Long-term trend is Strong Up.
Momentum : Price is Overbought currently, based on RSI-14 levels (RSI > 70).
Support and Resistance : Nearest Support Zone is $0.00027, then $0.0002.

FLOKIUSDT Cup And Handle Pattern!FLOKIUSDT technical analysis update
The price of FLOKI is breaking the cup and handle neckline resistance with high volume. We can expect a bullish continuation from the current level.
Regards
Hexa

FLOKI 1D bullish patternFLOKI / USDT
After 3 months of consolidation price is printed Cup and handle pattern
This is bullish pattern and we see an attempt to breakout
As long as price is holding above the pattern priority is strong bullish
Keep an eye

#FLOKI daily level target achieved, alert to fall back📊#FLOKI daily level target achieved, alert to fall back⚠️
💥As expected, the market successfully broke through the previous high and set a new all-time high.🚀
➡️From a structural point of view, a successful breakthrough means that greater room for growth has been opened at the weekly level. Although there is huge potential for future increases, we are currently in the daily-level target zone and it is impossible to chase the rise. If there can be a daily-level correction and the price returns to the buying zone, it will be very worthy of our attention. 👀
➡️Whether such a correction can occur or not is not important, what is important is to make corresponding trades in which area. If the market is as expected, then we will buy back the position we reduced in this selling zone when the price reaches the buying zone.⚙️
Let's see👀
✔️Trade safe✔️
🤜If you like my analysis, please like 💖and share it
👋follow me. Learn about further structural evolution💕
BINANCE:FLOKIUSDT

$FLOKI TO GIVE A 40% INCREASE SOON.CRYPTOCAP:FLOKI broke Ath and has retested the region.. now I expect it to give us nice pump in coming days..

FLOKIUSDT#FLOKI CRYPTOCAP:FLOKI Token Chart Update:
Looking at the chart, it has formed a beautiful pattern. First, it broke the ATH resistance and has maintained stability above the fib1 line. The next target is the fib1.618 level. Additionally, it has formed a cup and handle pattern, which indicates the same target.
So, we are ready for takeoff. Don't forget to fasten your seatbelts! 🚀

FLOKIUSDT Elliott Waves AnalysisHello friends.
Please support my work by clicking the LIKE button👍(If you liked). Also i will appreciate for ur activity. Thank you!
Everything on the chart.
Entry: Market and lower
Targets: 0.00022 - 0.00027 - 0.00035 - 0.00045
after first target reached move ur stop to breakeven
Stop: (depending of ur risk).
ALWAYS follow ur RM
risk is justified
Good luck everyone!
Follow me on TRADINGView, if you don't want to miss my next analysis or signals.
It's not financial advice.
DYOR!
