FLOKI NEW TARGET ATHso based on the most recent flag that was formed the next target is a new ath.
of course we have the top of the flag as a resistance. it is also a previous ath area . this may not break through on the first try but in my opinion if the market is strong it wont take much to get there
FLOKIUSDT trade ideas

FLOKI completed a setup for upto 21% pumpHi dear friends, hope you are well and welcome to the new trade setup of FLOKI with US Dollar pair.
Previously we caught almost 190% pump of FLOKI as below:
Now on a 4-hr time frame, FLOKI has formed a bullish Gartley move for the next price reversal.
Note: Above idea is for educational purpose only. It is advised to diversify and strictly follow the stop loss, and don't get stuck with trade.

Keep an eye on the #FLOKI/USDT Diagonal Trendline in 1-Hour TF!Keep an eye on the #FLOKI/USDT Diagonal Trendline in 1-Hour TF!
In case of Breakdown and retest to short it. The local support level is PWH $0.0002. The local resistance level is $0.000024.

FLOKIUSDT #FLOKI SEED_DONKEYDAN_MARKET_CAP:FLOKI has formed an ascending triangle. It has broken through the resistance and maintained above it, completing the retest. This indicates a potential upward movement. Positions can be considered accordingly.

#FLOKI Falling Wedge Breakout in 1D Timeframe. ✅#FLOKI Falling Wedge Breakout in 1D Timeframe. ✅
Ready to give a Bullish Wave. 📈
- High volume area was 0.00019005 which also broken.
- Breakout with huge volume.

#Floki price at a crossroads before further movement 🔀Modern cryptans love to trade meme coins and there is nothing to be done about it)
If trading volumes are in the top 10, then we need to analyze the coin, today about SEED_DONKEYDAN_MARKET_CAP:FLOKI
Wave analysis suggests that there may be one more correctional wave down to $0.0001
But another memecoin CRYPTOCAP:PEPE with a similar pattern has updated its local price high in the last week.
The critical level is $0.00025
Depending on where the #FLOKI price is fixed: above or below it, it will determine the further trend for several weeks/months.
So, watch the #FLOKIUSDT price movement and make trading decisions with two possible scenarios in mind
_____________________
Did you like our analysis? Leave a comment, like, and follow to get more

FLOKI About To Hit The New ATH👉 The Main Pattern Is Bull Flag By The Perfect ABC Corrective Structure And Also At The Lower Time Frame, There Is a Another Bull Flag Exactly Formed Below The Main Trend Line, Expect a New Bullish Rally By Breakout The Trend Line Toward a 0.023$, 0.028$ And 0.046$ As a New ATH

Floki Price Soars 13% as Kraken Launches Futures Trading Pair Kraken, a US-based exchange, has introduced Perpetual Futures Trading for Floki ( SEED_DONKEYDAN_MARKET_CAP:FLOKI ), causing a 13% increase in its price. This move has given SEED_DONKEYDAN_MARKET_CAP:FLOKI a mature reputation in the digital currency world and increased trading possibilities. Kraken's decision to include FLOKI in its trading environment signifies the rising recognition of its possibilities.
This innovation allows traders to predict FLOKI's price movements without owning the cryptocurrency, allowing them to either go long or short based on market forecasts. With over 10 million users, including institutional investors, Kraken's platform has increased liquidity and visibility of FLOKI. The price of FLOKI rose by almost 14%, indicating increased interest and optimism among investors.
FLOKI's inclusion in Perpetual Futures Trading coincides with its growing popularity in other financial platforms, including Revolut Business, Bitpanda Meme Coin Leaders Index, and major exchanges like Binance Thailand. As of press time, FLOKI's price was trading at $0.000212, an increase of 13.52% over the past 24 hours. The volume of trade in this period was $1,033,484,459, a 31% increase.
Floki's daily price chart depicts a "Bullish Symmetrical Triangle" which is poised for further gains. The memecoin's Relative Strength Index (RSI) which is at 64 signals a slight overbought condition for the token.

FLOKI: Double bottom pattern emerging! It seems like the price has been forming a double bottom pattern, and now is the time to keep an eye on FLOKI! If you're looking to trade FLOKI at the moment, here's a quick setup that you might find helpful!
The idea is: Buy when the price breaks above 0.000186$ and take profits at the levels shown in the chart.
Targets:
1. 0.000193$
2. 0.000205$
3. 0.000218$
-------------------------------------------
About our trades:
Our success rate is notably high, with 10 out of 11 posted trade setups achieving at least their first target upon a breakout price breach (The most on TW!). Our TradingView page serves as a testament to this claim, and we invite you to verify it!

FLOKI/USDTBINANCE:FLOKIUSDT
This idea has a long-term profit target.
All targets are indicated on the graph.
- Risk 1-3% on deposit
- R/R min 1/2
P.S (This is not an investment recommendation, this is my personal opinion.)

FLOKI Target DoneWhat is BIGGER than CRYPTOCAP:FLOKI ?
What is BETTER than CRYPTOCAP:FLOKI ?
Gave you the bottom when no one was even talking about it.
CRYPTOCAP:FLOKI has hits the ball out of the park🚀
Our First & Grand target perfectly smashed with 26% unleveraged move🎯💵

[FLOKIUSDT] - NEW ATH SOON!Breaking out many important resistance in daily chart:
- the descending channel , 50 ema ..
now extremly bullish and trading above 0.618 fib (golden level)
floki now top gainer in binance.
closing above the 0.618 meaning a new ATH is coming!
appreciating for supportingus with ur "like" and hit "follow" for more ideas🎯

📊#FLOKI correction has ended✔️🧠From the perspective of wave theory, we have broken through microwave 4, which means that the short-term correction has ended, and a good rebound has formed, indicating that we are moving to main wave 5.
⚙️The first goal worthy of our attention is to look forward to successfully breaking through the turning point.
If you hold it, then the bull defense point can be moved up to 15900.
Don’t forget risk management💯
✔️Trade safe✔️
🤜If you like my analysis, please like 💖and share it💬
💕 Follow me so you don't miss out on any signals and analyze 💯

FLOKI priceFLOKI price has rebounded from its 100 day EMA mark and reflected significant buying activity.


Floki: needs closing above 0.0002, accelerate floki jumping 🙂👍Personal idea: floki reversed bearish moving to bullish movements. Currently needs closing above 0.0002 and finding support in this price, if so can go at least to around 0.00045 -0.0005. Good 🙂 luck 👍

Floki: needs closing above 0.0002, accelerate floki jumping 🙂👍Personal idea: floki reversed bearish moving to bullish movements. Currently needs closing above 0.0002 and finding support in this price, if so can go at least to around 0.00045 -0.0005. Good 🙂 luck 👍

floki breaking bullish pennant seems like floki correction has already completed and now breaking bullish pennant incase of successful breakout expecting another higher high in coming days
expecting 120 to 130% bullish wave incase of successful breakout

🔥LOOK AT FLOKI REVERSAL POINTS: -67% AFTER BINANCE LISTINGHi, friends! Floki Inu is going to update the lows at $16.08. This will be a good entry point.
Also, you can this altcoins because it's a good point after -60% after the listing of fresh alts. Aptos and Render grown by 300-400% after such drawndown. Additionally, lot's of FUD appeared last days about memecoins.
Floki has only $163M of cap. How easy it will pump by 50% to it's closest resistance (order flow) or even to listing highs by 200%? Very easy and fast.
💥 why no one talk about #altseson? think about it and get a FREE pdf guide on how to buy altcoins on spot and make 10-20x in pinned links👇

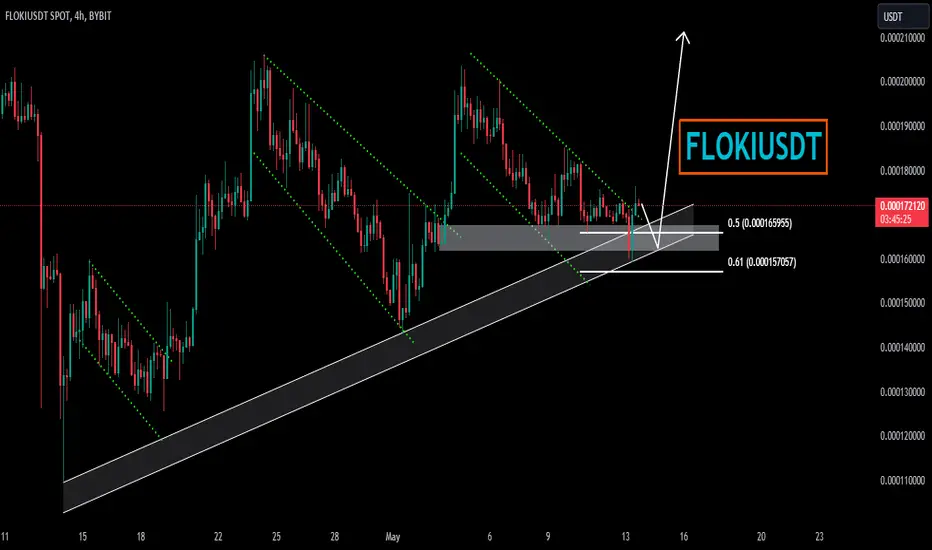
FLOKIUSDTFLOKIUSDT is in strong bullish trend.
As the market is consistently printing new HHs and HLs.
currently the market is retracing a bit after last HH, which is 50% Fib retracement level and local support as well. if the market successfully sustain this buying confluence the next leg up could go for new HH.
What you guys think of this idea?
#FLOKI Trading IdeaFLOKI/USD has formed a descending channel (pattern) and still holds at a potential support zone. Waiting for a breakout! This setup will be invalid if we don't see a clean breakout and the price continues to decrease further.

FLOKI / FLOKIUSDTLet's see
Good Luck >>
• Warning •
Any deal I share does not mean that I am forcing you to enter into it, you enter in with your full risk, because I'll not gain any profits with you in the end.
The risk management of the position must comply with the stop loss.
(I am not sharing financial or investment advice, you should do your own research for your money.)

FLOKIUSDTFLOKIUSDT is showing bullish divergence place a buy stop at 0.00017473 as it will breaking its Last LH plus wedge pattern
