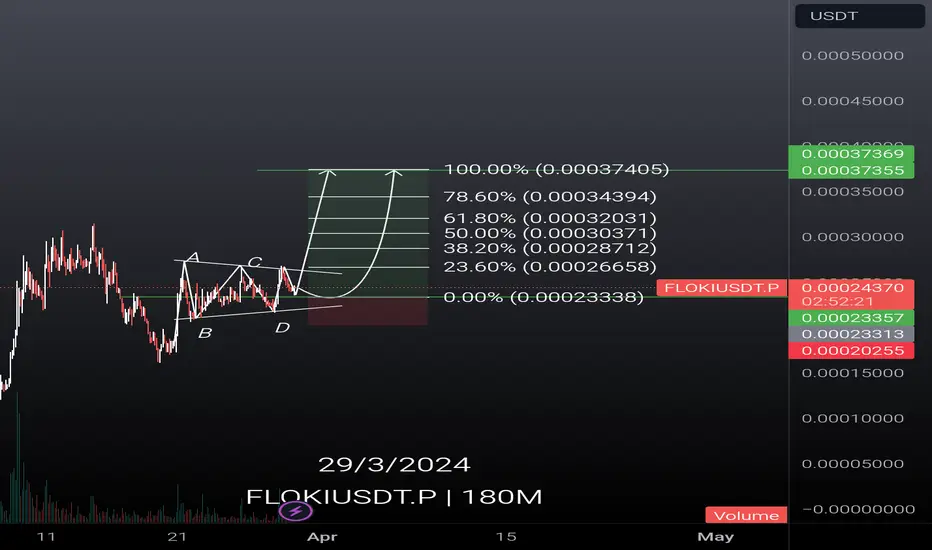
FLOKIUSDT.PHello Trader BITGET:FLOKIUSDT.P
still wns waiting for the bullish sym triangle area. but if you want to try it, go ahead, the valid area is 0.00026658 for the sym triangle, if you take it now the stop loss is quite far 13%.
take profit 60%
stop loss 13%
Please add a comment and Positive feedback and constructive criticism are important to authors and the community.
Disclamer: Not Financial Advice
FLOKIUSDT trade ideas
FLOKIUSDT.The chart for FLOKI/USDT shows an interesting pattern that warrants a closer examination. The price is oscillating within a rising wedge pattern, which is typically considered a bearish pattern despite the overall uptrend.
The Ichimoku Cloud is still below the price, indicating bullishness in the medium-term trend. Yet, the price is below the Conversion Line (blue), which might suggest a short-term bearish bias or a correction phase. The Lagging Span is above the price action but is approaching it, which could be an early warning sign of a potential downturn if it crosses below the price.
The RSI is at the midpoint, around 51, which is neutral territory. This doesn't provide a strong directional bias, but the fact that it's not in the overbought region means there is room for the price to move in either direction without immediate pressure from overbuying.
The MACD is showing a very slight bullish momentum as the MACD line is above the signal line, but just barely, and the histogram bars are quite small. This indicates that the bullish momentum is not strong and could easily flip.
Given the rising wedge pattern, which often resolves to the downside, and the indicators showing a lack of strong bullish momentum, I would prepare for the possibility of a downward breakout. The key support levels to watch are marked as S1 at 0.00016105 USDT, S2 at 0.00008947 USDT, and a much lower S3. A breakdown below S1 would increase the likelihood of testing S2 and potentially lower.
I would be cautious about entering long positions within this rising wedge. If I were holding FLOKI, I might consider setting a stop-loss order just below S1 to protect against the potential drop you’re anticipating. If entering a new trade, I would wait for a breakout confirmation. A bearish breakout would have me looking for short positions with targets set at S2 and beyond, while a bullish breakout above the upper trend line of the wedge might cause me to reevaluate for a potential continuation of the uptrend.

FLOKI is going to outperform SHIBA Inu! FLOKI is currently one of the hottest Memecoins in the crypto space, and the chart is looking super bullish! If you're looking to trade FLOKI at the moment, here's a quick setup that you might find helpful!
The idea is: Buy when the price breaks above 0.000257$ and take profits at the levels shown in the chart.
Targets:
1. 0.000265$
2. 0.00028$
3. 0.000297$
-------------------------------------------
About our trades:
Our success rate is notably high, with 10 out of 11 posted trade setups achieving at least their first target upon a breakout price breach (The most on TW!). Our TradingView page serves as a testament to this claim, and we invite you to verify it!

Massive breakout is coming!! Keep an eye on FLOKI! FLOKI is currently one of the hottest Memecoins in the crypto space, and the chart is looking super bullish! If you're looking to trade FLOKI at the moment, here's a quick setup that you might find helpful!
The idea is: Buy when the price breaks above 0.000257$ and take profits at the levels shown in the chart.
Targets:
1. 0.000265$
2. 0.00028$
3. 0.000297$
-------------------------------------------
About our trades:
Our success rate is notably high, with 10 out of 11 posted trade setups achieving at least their first target upon a breakout price breach (The most on TW!). Our TradingView page serves as a testament to this claim, and we invite you to verify it!

Floki/Usdt Idea Floki/usdt
Attempting breakout of this descending channel incase of succesful breakout 30-40% bullish move is expected for short-term
This is not financial advice

FLOKI to sonic boom! if BR continues....There might be some news behind this one like the one where Binance listing FLOKI/FUSD today! that could turn out bullish imo... dyor, non-financial advise.
pay yourself on the way up, ALWAYS!


FLOKIUSDT TECHNICAL ANALYSIS Florida flag pattern accepted and floki redu for pump tomorrow
Enter: 23
Target: 33
Stope: 18.1

The risk before breaking the trend line, unprincipled but attracWith the break of the short-term downward trend line, the beginning of a new upward wave even up to the previous ceiling and there is even a bullish signal for the chart to reach the previous ceiling, remember that anything impossible is possible for Floki

600% FlokiHello
After a delay and waiting to find a great signal, I found that FLOKI has the best potential for higher targets about 600%.

Floki Unveils Plans for Digital Banking & Debit CardFloki Coin ( SEED_DONKEYDAN_MARKET_CAP:FLOKI ) has unveiled ambitious plans to evolve from a meme coin to a comprehensive cryptocurrency financial solutions provider. With the release of its groundbreaking roadmap, Floki ( SEED_DONKEYDAN_MARKET_CAP:FLOKI ) is set to disrupt the crypto landscape by introducing digital banking accounts, debit cards, and a revolutionary crypto education platform, marking a pivotal moment in its journey.
Digital Banking Reinvented:
Floki's roadmap outlines its vision for digital banking accounts that can be seamlessly topped up with FLOKI tokens. These accounts will enable transactions in major currencies like dollars, euros, and sterling, ushering in a new era of financial inclusivity and accessibility. By integrating with global payment systems such as SWIFT and SEPA IBANs, Floki ( SEED_DONKEYDAN_MARKET_CAP:FLOKI ) aims to empower users with unparalleled flexibility in money transfers and transactions.
Debit Cards for the Digital Age:
Central to Floki's expansion plans is the introduction of debit cards, poised to revolutionize the way users interact with cryptocurrencies. Through strategic partnerships with leading payment networks like Visa and Mastercard, facilitated by a Swiss company under FINMA oversight, Floki's debit cards promise seamless integration into mainstream financial systems. This move not only enhances usability but also solidifies Floki's position as a formidable player in the fintech space.
Empowering Education with the University of Floki:
In a nod to the importance of education in driving crypto adoption, Floki ( SEED_DONKEYDAN_MARKET_CAP:FLOKI ) announces the launch of the University of Floki ( SEED_DONKEYDAN_MARKET_CAP:FLOKI ), a pioneering crypto education platform. Offering asynchronous courses on various cryptocurrency topics, initially free of charge, the University of Floki ( SEED_DONKEYDAN_MARKET_CAP:FLOKI ) aims to demystify the crypto ecosystem and empower users with knowledge. This initiative underscores Floki's commitment to fostering a community of informed and engaged crypto enthusiasts.
Revolutionizing Trading with Exclusive Tools:
Phase two of Floki's roadmap introduces exclusive trading tools, including a proprietary trading bot and Floki-powered bank accounts. Integrated with popular platforms like Telegram and Discord, the trading bot enables users to trade cryptocurrencies across leading blockchains using FLOKI ( SEED_DONKEYDAN_MARKET_CAP:FLOKI ) tokens. Notably, half of the fees generated by the trading bot will be allocated to purchasing and burning SEED_DONKEYDAN_MARKET_CAP:FLOKI tokens, driving scarcity and enhancing their value.
Riding the Wave of Success:
Floki's strategic initiatives come at a time of unprecedented growth, with the meme coin witnessing a staggering 600% rally in the current bull market. This meteoric rise underscores the growing demand for innovative crypto solutions and positions Floki ( SEED_DONKEYDAN_MARKET_CAP:FLOKI ) as a frontrunner in shaping the future of finance.

FLOKI Partners with World Table Tennis Championship: Surges 40% The cryptocurrency market witnessed a significant surge today as Floki Coin ( SEED_DONKEYDAN_MARKET_CAP:FLOKI ) soared by over 40%, marking a remarkable rally amidst its partnership announcement with the World Table Tennis Championship. This strategic move not only underscores Floki's commitment to growth but also highlights its innovative approach to leveraging sporting events to expand its reach in the cryptocurrency landscape.
Riding the Wave of Success:
Amidst a sea of cryptocurrencies, Floki Coin ( SEED_DONKEYDAN_MARKET_CAP:FLOKI ) and its partner TokenFi emerged as top performers, gaining substantial attention from investors. The surge in both tokens' prices reflects the market's enthusiastic response to their collaboration as the official cryptocurrency partners for the upcoming World Table Tennis Championship in Incheon, South Korea.
Strategic Partnership Unveiled:
Floki's collaboration with TokenFi signifies a strategic endeavor to capitalize on the global appeal of sporting events. With the World Table Tennis Championship set to draw a massive audience, estimated at around 450 million viewers worldwide, Floki ( SEED_DONKEYDAN_MARKET_CAP:FLOKI ) aims to seize this opportunity to enhance its visibility and engagement on a global scale.
Expanding Footprint in Sports Sponsorships:
Floki's foray into the sporting world is not a new endeavor. With prior engagements in table tennis tournaments in Frankfurt and Busan, Floki ( SEED_DONKEYDAN_MARKET_CAP:FLOKI ) has steadily built its brand recognition within the sports community. The partnership with the World Table Tennis Championship further solidifies Floki's position as a key player in sports sponsorships, opening doors to new opportunities for growth and expansion.
Seizing the Opportunity in South Korea:
By associating with the WTT Champions Incheon event, Floki ( SEED_DONKEYDAN_MARKET_CAP:FLOKI ) demonstrates its strategic initiative to tap into South Korea's burgeoning cryptocurrency ecosystem. This move aligns perfectly with Floki's community-building efforts and underscores its commitment to fostering relationships in key markets.
Impressive Performance and Market Impact:
The surge in Floki's price, coupled with a significant increase in trading volume, reflects investors' confidence in the cryptocurrency's potential. With an impressive gain of over 600% in the last 30 days, Floki's bullish momentum highlights its growing prominence in the meme coin sector.
Conclusion:
Floki Coin's partnership with the World Table Tennis Championship represents a significant milestone in its journey towards global recognition and adoption. By leveraging the expansive reach of sporting events, Floki ( SEED_DONKEYDAN_MARKET_CAP:FLOKI ) demonstrates its ability to innovate and seize strategic opportunities in an ever-evolving market. As the cryptocurrency continues its upward trajectory, fueled by strategic partnerships and a dedicated community, the future looks promising for Floki and its endeavors in the cryptocurrency landscape.

🐶Floki Inu(FLOKI)🐶 is Ready to Fall at least 🚨➖30%🚨🏃♂️ Floki Inu(FLOKI) is moving near 🟡 Potential Reversal Zone(PRZ)($0.00035-$0.00030) 🟡and All-Time High(ATH) .
🌊According to the theory of Elliott waves , it seems that Floki Inu(FLOKI) has completed the main wave 3 , and we should wait for corrective waves .
💡Also, we can see Regular Divergence(RD-) between two Consecutive Peaks .
⚖️ Floki Inu(FLOKI) seems to be completing similar moves , so moves 1 and 3 are almost identical in terms of percentage increase , and we can expect moves 2 and 4 to be almost similar in terms of percentage increase.👇
🔔 Based on the description above, I expect Floki Inu(FLOKI) to drop at least ➖ 30%.
❗️⚠️Note⚠️❗️: Analysis will change if Floki Inu(FLOKI) can break 🟡 Potential Reversal Zone(PRZ)($0.00035-$0.00030) 🟡.
❗️⚠️Note⚠️❗️: An important point you should always remember is capital management and lack of greed.
Floki Inu Analyze ( FLOKIUSDT ), 1-hour time frame ⏰.
Do not forget to put Stop loss for your positions (For every position you want to open).
Please follow your strategy; this is just my Idea, and I will be glad to see your ideas in this post.
Please do not forget the ✅' like '✅ button 🙏😊 & Share it with your friends; thanks, and Trade safe.

FLOKIUSDT.PHello Trader BITGET:FLOKIUSDT.P
is in its strong resistance area, there is a possibility to have a correction and continue for bullish sideways. I take this risk area and can be short for now.
Please add a comment and Positive feedback and constructive criticism are important to authors and the community.
Disclamer: Not Financial Advice

Flokiusdt h1 Structure ShiftFLOKIUSDT H1 timeframe structure has shifted, and FVG has also formed. FVG will likely be tested before moving up.

FLOKI's Market BehaviorFLOKI is currently trading at 0.0002639, showing signs of consolidation after its recent upward movement. Here's a closer look at the technical aspects shaping its market behavior:
Support and Resistance: The absence of a clear resistance level above the current price suggests that the market is still in the process of establishing a new ceiling for FLOKI. The noted gap, indicated by the green line, points to a zone where the price might potentially retract and stabilize.
Main Support Level: The chart indicates a solid main support level that has been consistently holding. It’s a key area to watch for maintaining the current uptrend.
Relation to Bitcoin’s Activity: FLOKI has mirrored the general market trend, showing reactivity to Bitcoin's performance. The positive correlation means that a further rise in Bitcoin could propel FLOKI similarly.
The price action is within the Bollinger Bands, suggesting no immediate overextension of the price movement in either direction.
A significant trading volume of 11.639B reinforces the current price level, indicating a solid interest in the market.
The SMA is set at 0.00027077, slightly above the current price, which could act as a dynamic resistance in the short term.
The MACD histogram is slightly negative, suggesting a bearish divergence. This warrants attention, as it may prelude a potential slowdown or reversal in momentum.
Stochastic RSI is Currently low, suggesting that there might be potential for an upward price movement before becoming overbought.
Traders should monitor the support levels and watch for the MACD and Stoch indicators for signs of either a continuation of the current trend or a reversal. Given FLOKI's correlation with Bitcoin, movements in the primary cryptocurrency's market could be indicative of FLOKI's subsequent direction.
Enjoyed the analysis? Don’t forget to hit like, drop a comment with your thoughts, and share it with your friends.

FLOKI: Set your alerts!! It's time to keep a close watch on FLOKI, which is gearing up for a big move! If you're looking to trade FLOKI at the moment, here's a quick setup that you might find helpful!
The idea is: Buy when the price breaks above 0.000242$ and take profits at the levels shown in the chart.
Targets:
1. 0.000249$
2. 0.000261$
3. 0.000279$
-------------------------------------------
About our trades:
Our success rate is notably high, with 10 out of 11 posted trade setups achieving at least their first target upon a breakout price breach (The most on TW!). Our TradingView page serves as a testament to this claim, and we invite you to verify it!

New Setup For FLOKI - Set Your Alerts!!!If you're looking to trade FLOKI at the moment, here's a quick setup that you might find helpful!
The idea is: Buy when the price breaks above 0.000243$ and take profits at the levels shown in the chart.
Targets:
1. 0.000248$
2. 0.000257$
3. 0.000262$
-------------------------------------------
About our trades:
Our success rate is notably high, with 10 out of 11 posted trade setups achieving at least their first target upon a breakout price breach (The most on TW!). Our TradingView page serves as a testament to this claim, and we invite you to verify it!

flokiusdtSupport and press the rocket to cheer me up
Observe the ten percent loss limit
Stay away from Bitcoins
Feel free to buy and sell and post your comments

The big move is coming! Set your alerts!!It's time to keep a close watch on FLOKI, which is gearing up for a big move! If you're looking to trade FLOKI at the moment, here's a quick setup that you might find helpful!
The idea is: Buy when the price breaks above 0.000285$ and take profits at the levels shown in the chart.
Targets:
1. 0.00029$
2. 0.000296$
3. 0.000305$
-------------------------------------------
About our trades:
Our success rate is notably high, with 10 out of 11 posted trade setups achieving at least their first target upon a breakout price breach (The most on TW!). Our TradingView page serves as a testament to this claim, and we invite you to verify it!

FLOKIINU NEXT MOVEIt is High Time.. Be ready With Your Floki New High Coming in Very Short Time.. :)
SET STOP LOSS On Your Trade
Risky Call

FLOKIUSDT - Watchout for right entry before going longHello guys,
this is a new analyse for FLOKIUSDT.
I hope you like that and can work with that for the right entry point for the next upward movement.
Now we are in a retracement, and will look forward if we can hold the zones on this prices:
0.000263940 (if we lost this price we came to) 0.000252 - 0.000257.
If we lost 0.000252, we can go deeper to 0.000232.
If we bounce from 0.000252 - 0.000263, we can go easy higher to following prices:
0.00031
0.00033
0.00038

FLOKI SEEMS TO ENTER NEW VOLUME TIMEThank you for reading this update.
FLOKI seems to enter an important trend that could end in a break.
FLOKI have at this moment interesting view depending on TA.
