FLOWUSD trade ideas

FLOW still in downward movement relative to BTCwhat is interesting is that FLOW still underperforms BTC

Flow Mirror run - revisedSadly havent seen much chatter about Flow of late.
playing with shapes and depending on what is in the works for the project perhaps an mirror like run is possible.
if anyone has news drop it in the comments please

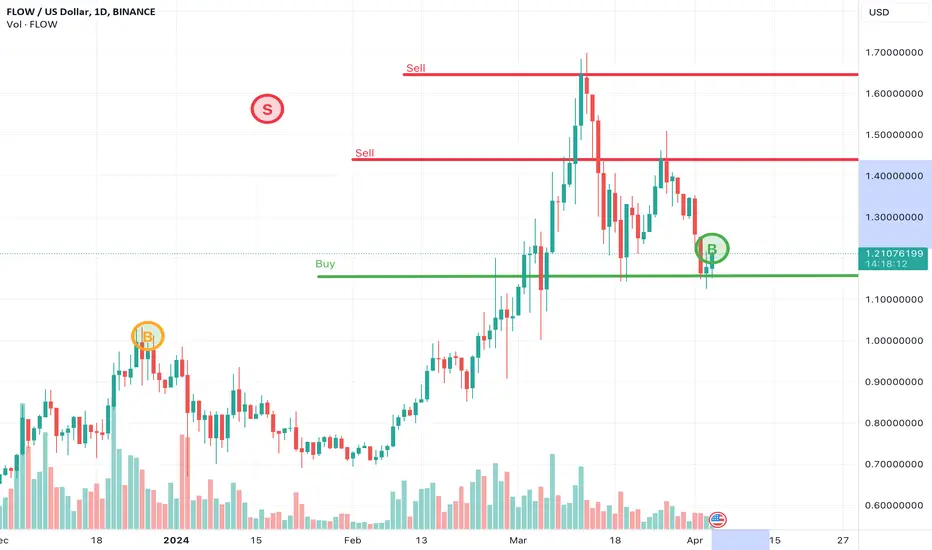
FlowFlow is an interesting blockchain platform which was in a downtrend move since the birth! It is evident from the chart that lower lows were made one after another. However, price have recently broke the downtrend line and if one higher high and one higher low occur, we can hope for a reversal. Let's see what happens.

Go with the FLOWAfter a long year bear market FLOW is gonna enter the stage of massive expansion.
I will keep updating every few months how this gonna play out.


Flow LongFlow has a double bullish shark at support with three counts of holding support and higher lows signifying accumulation.

FLOW - Mirror Run??FLOW peaked and declined pretty steadily last run. Could we see a mirrored upward performance this cycle?
If anyone has news on what FLOW is doing/planning lately, drop it in the comments.
Wondering if we may have a sleeper thats worth watching


$100 invested into flow for 11 days.I usually invest around $300 per trade, but my account is currently running low and need to top it up, I invested $100 flow so I can sell it for an 18% profit. That is $18.
$FLOW Trading IdeaFLOW/USD (FLOW) is going with the flow, together with a trend creating higher lows. But now we face a massive resistance zone (around $1.50). Full send after a breakout. The next Supply Zone is around $4.808-$5.00.

Those who went with the $FLOWUSD are ... DROWNING! Big Shitcoin!This must be the weakest, dumbest shitcoin in existence. It is even weaker than FIL , which speaks volumes. This shitcoin is still down 97% from its all-time-high and has not had a significant rally despite the entire crypto space mooning into orbit.
Remember the shills when they tweeted and posted tradingview ideas about this ponzi, telling you to just go with the FLOW ? If you went with the #FLOW, chances are you drowned or still drowning.
I expect this shitcoin to dump into the depths of hell soon.
HUGE RED FLAG: This shitcoin is traded on every major exchange and on every major pair and supposedly has mega high volume, but is unable to even rise $0.05 and hold it. MAJOR RED FLAG, shows there is no demand, only bagholders keeping each other down and preventing each other from going over water and floating with the #FLOWUSDT instead of drowning with the #FLOWUSD (or #FLOWBTC).

$FLOW, next stop $3?Flow looks extremely bullish here. 4hr, 8hr, 12hr, 1D are all in bullish territory on the RSI and have room for a large move up.
Price just broke out and backtested support.
It's only a matter of time before $3 is hit.

FLOW BullRuns Will Start Soon, (Elliott Wave)Whales are accumulating, buy before they send it to the moon.
Please Only do swing or position trading and Do Not Buy and Sell Regularly.
DYOR
Thank you for considering my analysis and perspective.

FLOW UPLow supply expecting a healthy uptrend and making new ATH
This can be the last opportunity to buy low during pre-halving time.

FLOWUSD - IdeaAn idea suggesting a pullback and then prompt rise.
The pullback completes inverse H&S pattern.
The completion allows switch from bear to bull.
Bull market ensues for FLOWUSD.

$FLOW forming a cup and handleAMEX:FLOW has formed a cup and handle and the handle is in a wedge pattern. Could break to the upside but must break $0.70, test that resistance and confirm a breakout before going long on it.

🌊 Riding the Wave: Uncovering FLOW's Market Divergence! 📊Hello Crypto Explorers! 🧭
Have you tuned into FLOW's recent market activity? There's something fascinating unfolding! 🧐 I've been analyzing the crypto market and noticed a potential divergence in FLOW and in another ALTCOINS.. This could be an indicator of an exciting shift! 🌪️
Why FLOW? 🤔
For those who aren't familiar, FLOW is more than just a digital currency. It's a fast, decentralized, and developer-friendly blockchain, designed to power the next generation of apps, games, and digital assets. 🎮📲 Its unique multi-role architecture and emphasis on usability make it a standout in the blockchain space.
Divergence Detected! 🚨
On the charts, FLOW is showing a divergence between its price action and market indicators. This could be hinting at a momentum for FLOW's future.
The Potential Impact 🎯
Identifying divergences in tokens like FLOW can offer insights into future trends. For savvy investors and enthusiasts, keeping an eye on these patterns is essential for navigating the volatile waters of the crypto market. 🌊
Why Keep an Eye on FLOW? 👀
Recognizing divergences can be key to navigating the choppy waters of the crypto market. For FLOW, this divergence might be the key for upcoming trends or shifts. Whether you're a trader or just crypto-curious, watching these patterns can offer valuable insights. 🌟
Let's stay alert and see where the FLOW takes us!
#FLOW #CryptoTrends #MarketDivergence #DigitalInnovation

📉🚀 #FLOW/USDT Falling Wedge Setup Alert 🚀📉Hey traders! 📣
I've identified an exciting opportunity on the $FLOW/USDT chart. 🧐
📉 Price Action: FLOW is currently forming a falling wedge pattern, which can be a bullish sign! 📈
📊 Technical Analysis:
Falling Wedge Pattern ✅
Decreasing Volume ✅
Potential Breakout Brewing ✅
📅 Timeframe: Keep a close watch on this setup as it unfolds, and patience may pay off.
🎯 Entry Point: Consider an entry upon a breakout above the upper wedge trendline. 🚀
🛑 Stop-Loss: Prudent risk management suggests setting a stop-loss just below the lower wedge trendline.
🎯 Price Targets (Next 3-6 months):
Short-Term: Target the wedge's upper trendline, aiming for $0.80 - $1.00 🎯
Mid-Term: If momentum continues, target $1.00 - $1.40 🚀
Long-Term: For the patient traders, the wedge's full potential could reach $1.40 - $3.00 🌟
🚀 Major Swing Target: The ultimate goal is a swing to the top of the wedge at ~$28. 🌠
Remember, always conduct your own research and use appropriate risk management strategies.
Let's keep a close eye on $FLOW/USDT as it approaches the wedge apex! 🤑💰
Happy trading! 📈📉🤞
#Crypto #TradingView #TechnicalAnalysis #FallingWedge #BullishSetup

FLOWUSD Huge Falling Wedge and 4hour MA200 breakoutFLOWUSD is crossing today over both the giant Falling Wedge pattern that started at the beginning of 2023 and the 4hour MA200, which has been a Resistance since July 24th.
It is easy to understand that this is a major bullish development for the long term trend. The short term Resistance that is left is the 1day MA50 and that is only $3 away.
As you see we've split the analysis into two charts the 4hour (left) and the 1day (right). Both have the next common bullish benchmark at 0.63500, on the 4hour that's the 0.618 Fibonacci from the July 3rd top and on the 1day it is an estimated contact course with the 1day MA200, the major Resistance October 5th 2021! This can be used as the target.
50% buy can be entered now and the other 50% after a 1day candle close over the 1day MA50. Target 0.63500.
Follow us, like the idea and leave a comment below!!

✴️ Flow Bullish PotentialI am getting the feeling that we will have the second have of the week go bullish.
Bearish the first half, bullish the second half.
FLOWUSD is repeating the same from early January and it broke out of a downtrend recently.
While the last three days were red, this is something to be expected, the market shakeouts weak hands before moving ahead.
We have this pattern that preceded a bullish wave repeating after a new low, more than 100% correction. If there was strength to move up in January, today there should be more, because Bitcoin is stronger, the market is stronger and people are ready to experience some Crypto gains for a change of pace... Are you not?
Yes you are... Of course!
The bulls win. I am a bull. You are a bull. We all win.
Great, that's what I love.
Namaste.

FLOW will start its first wave and it will be epicFLOW sold off hard last year which could fuel its big run even more and probably do the same what AAVE did a few years ago.

FLOW - Falling Wedge - Back tested perfectlyThe falling wedge pattern is a bullish reversal pattern that is formed when the price consolidates between two downward sloping trend lines. This pattern is characterized by a narrowing price range as the price approaches the apex of the wedge. The breakout from this pattern is usually to the upside, indicating a potential trend reversal.
In this case, we have identified a falling wedge pattern with a swing target to the top of the wedge around $27. Traders can look for a breakout above the upper trend line of the wedge to confirm the reversal and enter a long position.
Once the breakout occurs, traders can set their target around the top of the wedge at $27. It is important to use proper risk management techniques such as setting a stop loss to protect against potential losses.
Overall, the falling wedge pattern can be a powerful tool for identifying potential trend reversals and trading opportunities. By understanding the pattern and using proper risk management techniques, traders can potentially profit from the expected bullish movement.
