FLUX ANALYSIS🔮 #FULX Analysis 🚀🚀
💲💲 #FLUX was trading in a Falling Wedge Pattern, give a perfect breakout with high volume. If the price of #FLUX closes above $0.4950 then we will see a bullish move. 📈📈
💸Current Price -- $0.4893
📈Target Price -- $1.348
⁉️ What to do?
- We have marked crucial levels in the chart . We can trade according to the chart and make some profits. 🚀💸
🏷Remember, the crypto market is dynamic in nature and changes rapidly, so always use stop loss and take proper knowledge before investments.
#FLUX #Cryptocurrency #Breakout #DYOR
FLUXUSDT trade ideas

FLUXUSDT 3D#FLUX breaking out the falling wedge and now it is testing the MA100 on 3-days chart. You can buy a small bag here and next step for buy is around $0.41 ~ $0.42. You can see targets on chart.

flux getting ready for massive bullish rally seems like flux has already bottomed out and finally preparing for solid recovery in midterm
breaking multi year trendline incase of successful breakout expecting 2x bullish rally in midterm keep eyes on flux for confirmed breakout
never take any entry without breakout

FLUX/USDT bullish continuation from support retest?👀🚀 💎 Paradisers! FLUXUSDT after facing rejection from a formidable resistance, it's gearing up to embark on a bullish journey from its support level.
💎 A closer examination reveals that FLUX has touched the .3528 mark thrice. Currently, it's revisiting the support level at .3072, and we anticipate a bullish resurgence from this point. However, should it breach below this support, our bullish outlook would be negated.
💎 Above, there's a distinct supply zone and an area of price imbalance. It's highly probable that the price will venture to this zone in the near future to address this imbalance.
💎 Remember to employ prudent trading strategies and use proper stop-loss measures! Stay alert to market movements and look forward to more insights!

We love Flux!Flux belongs in the top 50 projects and it is highly undervalued as a DePin. Not to mention it is a disinflationary proof of USEFUL work coin. Great fundamentals, DePIN projects will lead to greater crypto adoption. You are very early anon, don't mess this up. Flux is a small cap project and only retraced 91%, there are large caps that retraced more. Not a lot of selling with this project and we are passed the halving. Send it, let it run.

$FLUX COIN, THE FATHER OF ALL WEB 3 PROJECTS IN CRYPTO SPACEYes, you read it right.
Flux Coin will be the next 10x, 20x, and who knows, it might even reach 50x. With its supply, reaching $10 seems easy in the next bull run, especially when they release its Proof of Useful Work.
The Flux management and developers are continually building its ecosystem to sustain the possible circumstances of their PoUW, despite the bear market season.
Its all time high was $4.17, and it seems that reaching the said minimum target is easy,
IN MY CHART:
Let's talk about the technical side of $FLUX. I have been closely monitoring its movement on a weekly basis, and it appears that the accumulation is hovering around $0.30 - $0.33, which, in my opinion, signals a healthy trend. Flux is currently undergoing a consolidation phase, reflecting a markdown trend. However, if the price breaches its key resistance, the bulls will likely attempt to push it back to around $0.8.
My buying zone falls within the range of the green box. Anything below that will be my dollar-cost averaging (DCA) zone.
FUNDAMENTAL PART:
The Flux ecosystem is focued and devoted to empowering everyone to develop, deploy and use the decentralized Internet of the future: Web3, it is a powerful decentralized computational Flux Network (FluxNodes), a Linux based operating system (FluxOS), the premier digital asset platform (Zelcore) and, finally, the Flux blockchain for on-chain governance, economics and parallel assets to provide interoperability with other blockchains and DeFi access.
DYOR
Plan your execution of trades, so that you don't plan to fail.
Happy Trading, everyone.

FLUX/USDT
great set up here tbh, nice falling wedge pattern, it has potentially bottomed out and created a nice support on the green line, two targets here would be the white dashed resistance line and the 200 EMA blue line.
Put SL below the green support line!
GL

3 pumps of FLUXIt's so clear for me that FLUX is going to do 2 great moves very soon within 4 months as it's already finished the accumulation phase 3
Now the prices it 0.325 on date 24 Sep 2023
- The first target is going to be approximately 137% targeting 0.78
- The second target is 239% targeting 1.12
These moves could happen before the next bull run

FLUX Buy Limit 😎✅😎✅😎✅Hi dear traders
FLUX on 1H time frame
We can see bullish divergence between price and RSI.
Volume is great.
Strong demand zone.
We can open long position with suitable R/R.
Let's see what happens
This is not financial advice ( DYOR )
Good luck

Flux Looks Ready For Massive Recovery Seems Like Ready for Massive Recovery Keep Eyes On flux
Formed Text Book Descending Channel In Daily Tf And Approaching Towards Trendline Incase Of Breakout Expecting Massive Bullish Rally In Coming Days
Incase Of Successful Breakout Expecting Move Towards 1$

FLUX / FLUXUSDTI see FLUX looks good if it does not close below the last low that was formed.
• Warning •
Any deal I share does not mean that I am forcing you to enter into it, you enter in with your full risk, because I'll not gain any profits with you in the end.
The risk management of the position must comply with the stop loss.
(I am not sharing financial or investment advice, you should do your own research for your money.)

Flux Getting Ready For Move Towards 1$On Verge Of Massive Breakout Formed Descending Channel In Daily Timeframe In case Of Breakout Expecting Move Towards 1$ Keep Eyes On Flux For Breakout

✴️ Flux [NYA]This is great. I saw this one last with great potential on it last month.
In this chart we have a new year+ low but the current price trades above it.
FLUXUSDT is also trading above its June 2022 low, which is really good.
If it takes off here you might be looking at a bottom catch.
As long as this pair trades above 0.365 it has a very strong bullish bias.
For a trader, this would be a very low risk setup if you use the above mentioned number as the stop, with a great potential for reward, we are looking at 279% but it can be more.
The chart always has many patterns we can look at and one pattern using one system correlates with another pattern in a different system, so you can find tons of signals to support your bias on the same chart. This is mostly irrelevant, the market moves in cycles and within these cycles we have waves... That's all that matters.
If we enter a new bullish wave, it will go up regardless of the indicators, the volume, the candles, the chart.
If the bullish wave is delayed, you either get more consolidation or a bearish continuation.
Since my believe is that a bullish wave is now taking form, we can expect Flux to go up.
We use this information only as an adjunct to a system we must have and develop before buying any coins.
This is not financial advice.
The charts can always change.
I see it going up.
Namaste.

FLUXUSDTAccording to a oscillator in weekly major support will be broken and goes to one of two targets I've marked.

Flux to the moonThe flux chart is at its historical price floor and can see long-term targets of 0.59 if supported.

FLUX/USDT FLUX is looking to break out of a symmetrical triangle, so if it does, there is an expectation of a 60% increase in price.

FLUXUSDT
// Trade entry - $FLUX spot //
asset: #FLUXUSDT SPOT
position: LONG
entry price: ( avg .) 0,82
stop loss: 0,70
max profit target: 5,13
risk reward: 1 : 33
#goodluckall #crypto

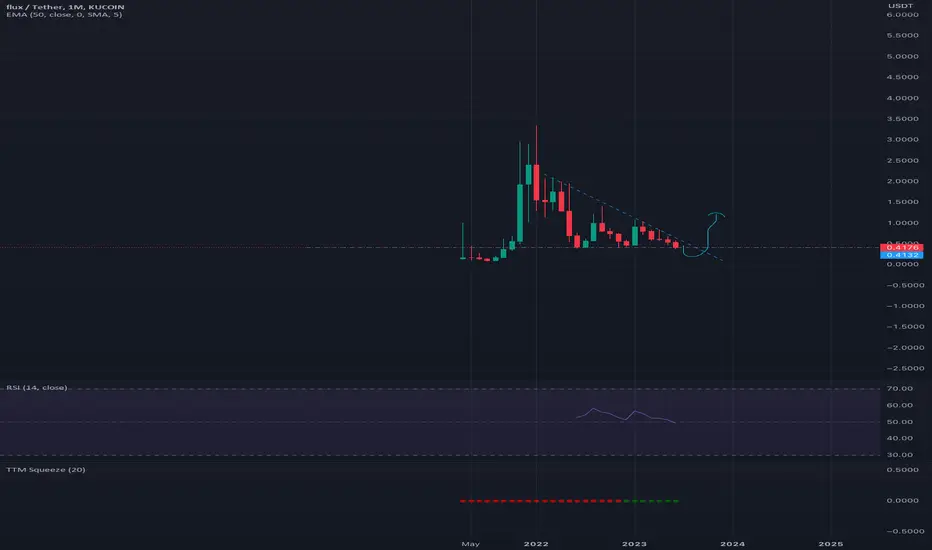
FLUXUSDTFLUX is gearing up for a bullish shift shift as it approaches a potential breakout from a falling trendline.
Currently, it's trading within a high-demand zone and maintaining a strong momentum above the 50-day Exponential Moving Average (EMA), reinforcing the bullish outlook.

FLUX /USDT upward momentum ahead !!👀 🚀Flux Today Analysis💎it is gearing up for an intriguing shift as it approaches a potential breakout from a falling wedge pattern.
💎 Currently, it's trading within a high-demand zone and maintaining a strong momentum above the 50-day Exponential Moving Average (EMA), reinforcing the bullish outlook.
💎 Another key point is the upward momentum shown by the RSI, as it's above the 50 mark, which is a factor that can't be ignored.
💎In the dynamic world of crypto, staying informed and adaptable is key. Stay tuned for more updates and enjoy your trading journey

Flux Looks Promising For bullish impulseSeems Like getting ready for Massive Bullish impulse Formed descending channel incase Of breakout Expecting 55 to 60% bullish Wave

✴️ Flux Network Has Long-Term PotentialHere is another Altcoin that caught my attention, I get the feeling that it is going to a big one in future cycles.
Bullish signals for FLUXUSDT, we have the bullish divergence with the RSI since November 2022 to start.
Two 3D sessions (6 days) already closed green with a great start on the current one.
The volume. There is a huge increase in trading volume after May.
You can find targets and also the support level marked on the chart.
Wishing you profits, great profits, success, wealth, health and luck!
Namaste.


Flush to .30 then send it to $1.20 Flush to ~.30 next month on a wick then send it to $1.20 by end of summer