EU50 trade ideas


Bullish? Is it Bullish?For sure it looks less bearish now after two days of massive short covering. Bit it is NOT bullish at all!
Weekly:
- Ichimoku setup -> Bearish
- Major trend is bearish!
- Heikin-Ashi shows indecision so far this week. haDelta up to zero, but its SMA3 is still below.
- upper key supp/res is Kijun Sen at 2993. Lower bearish resistance is 2800.
- EWO is bearish
Daily:
- Ichimoku setup still has a bearish bias! Price retesting Kijun and forward Senkou B. This setup can not turn bullish until Price trades below 3000-3050.
- Heikin-Ashi is swing bullish, with strong momentum in last 4 days. But Price reached important support resistance zone, and haDelta hits a relative high level. Momentum will most likely slow down here in comeing days.
- EWO is bearish
Brexit or Bremain? In case of Bremain we can see strong rally to 3200... but in case of Brexit... well I doubt 2800 will help anybody who is left long.
As I wrote before on Twitter, not Brexit odds and polls what are important here. I think the question is which position can people stop easier and what would cause the bigger pain? Since most of bears got grilled in last few days, how do you think the liquidity is going to be in case of a "Leave" outcome? How do you think the whole world which is naturally massive long in equities would be able to exit? On the opposite side, I think it would be lot easier to cover shorts, or there will be still enough time and good levels to enter longs again if you wish.
I think the better risk/reward is to keep neutral or small short position before the vote. But not long! Being long risk is a gambling here!

Relief Rally In Global EquitiesGlobal Equities are experiencing a relief rally after a bizarre turn on events. For some reason, the brazen murder of British M.P Jo Cox turned the increasingly large "leave" vote around, and the "remain" vote regained the led heading into Thursday's Brexit vote.
The Euro Stoxx 50 Index jumped off of technical support of 2,814 but still remains in a clear downtrend of 2015's bubble-high of 3,837. Since last year's top, the index has made several lower-lows, and the current trend from the bear market bottom has etched out two clear lower-highs.
Given the state of the brief risk aversion seen last week as the "leave" vote took a pronounced lead, global were "due" for a rebound. As alerted earlier last week, the near-term momentum was set for a shift:
twitter.com
If you look across European equities, the prospects are not turning out like many thought. In regards to the Euro Stoxx 50, price action does not get interesting until a close above the near-term, broken uptrend AND prevailing downtrend is confirmed. The 200-day EMA will be a key pivot point. The index has not been able to trade above this dynamic resistance since last December.
Wait for price to trade into resistance near 3,000/025. MacroView does not expect Britain to leave the European Union, but there are far too many risks to get excited about.
Check out Bloomberg's Brexit tracker, currently showing a small Brexit lead.
For more information on MacroView's products, or general questions and comments, feel free to message us.
Also, readers are encouraged to post their thoughts and charts!
Follow MacroView CoFounders on TWTR1.45% @Lemieux_26 and @EconomicHedge


EUSTX50 - STOXX50 Building a Nice ChannelIf you like my Idea please click that Like button. Thanks and best of luck trading!

BAT BULLISHpersonally, I don't trade this Indices. I'm sorry if then doesn't work properly, just share some thought.
know what you do and take care :)


STOXX 50 On Top. Be Ready To Short.There's only a little chance of breakout up.
Please make sure to click Like button if you like my Idea!

If Bulls can hold 3000 key, market can target 3200+- Ichimoku setup is neutral: Price is in a thin cloud, all longer averages ard same level 3000+. This is the equilibrium price.
- Heikin-Ashi candle yesterday had a slightly higher low. Could not break back below Kijun Sen and spot Kumo cloud. Today candle and haDelta indicates indecision, and maybe a bullish reversal ahead!
- In case Heikin-Ashi gives a firm bullish signal, then market can target 3200 again. This would mean complete invalidation of the possible bearish Head and Shoulders pattern.
- EWO is still slightly above zero.
Weekly:
Full of questions:
- Are we gonna have a weak bullish Tenkan/Kijun cross here?selling interest there.
- Price is stuck exactly at Tenkan and Kijun. What about Heikin-Ashi momentum? How will the candle look like at the end of this week?
- haDelta/SMA3 crosses down, but still above zero line. What about momentum?
- 3200 is a ston bearish support, and probably market will face serious
My short term bias is less bearish now. Still hard to decide wether it is an early signal for next leg up, or just hesitation before a break down and H&S pattern validation. Interesting days ahead.
We can not exclude the possibility of a rally towards 3200. But as you see on weekly chart, that could well be a strong supp/res area, and a level to look for short entry again.


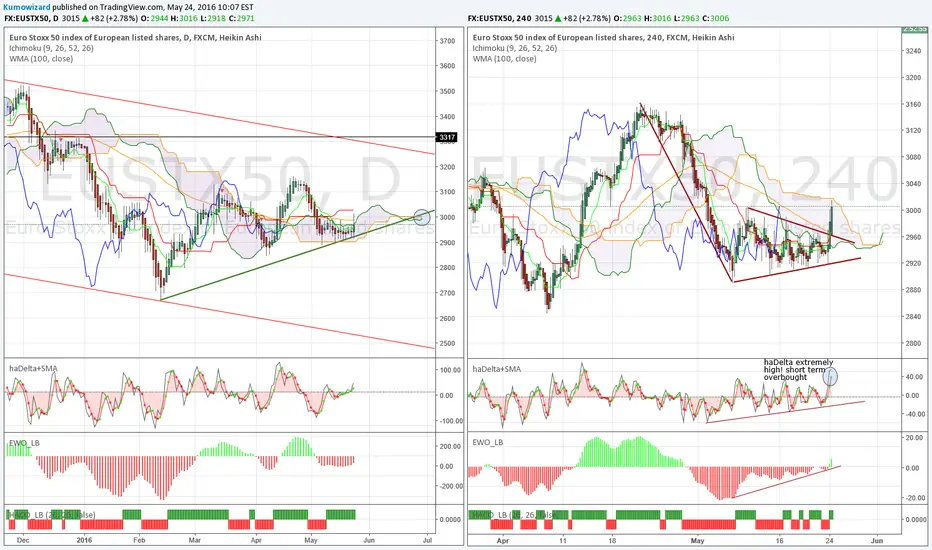
Retracement sell.This divergence was/is too much for the market.As I showed you yesterday on Twitter, "Machines" don't care about divergences. But smarter Human should.
What is stretched is stretched. Market reached daily resistance ard 3100, and 4H has become extremely overbought.
Market has to retrace or consolidate a bit. Then we'll see if it finally builds the Head and Shoulders on the daily, or if it goes really bullish.
For the short term it is a sell... at least in small size.
Major key level is still a lot lower ard 3000+


Sometimes things look obvious, but opposit happensThat's why we have to use trailing stops!
Look at this 4H chart and pattern!
Obviously Ichimoku setup was bearish, price action showed consolidation with flat/slightly higher lows and lower highs --> absolutely looked like a bear flag.
And what happened? Market agressively spiked through the 100WMA into the thick Kumo.
Today's price action turns the whole picture rather bullish biased again, but I believe this move was a bit too fast.
4H Kumo top will likely block it for now. Also haDelta has reached an extreme high. The index faces daily Kijun resistance too at 3026.
Market will possibly chill down, but later we may see another leg up. If you wish to go long, wait for a pull back to 2970-2980.
AB=CD on the EuroStoxx for 2840 and 2700?- Failed and rejected off the UTL of February low
- Price converging in a triangle wedge
- RSI is oversold but not diverging to support a strong rebound
- Target for 2840 seems possible if it broke out of the wedge


Eurostoxx 4 hour is going bullish- If previous fractal via the candles and RSI serves right, it may well break above 3020 and trade higher
- It remains a strong IF but it looks entirely possible as longer TF will post a strong rebound and bullish candles
- With that in mind, the bias is not to short or fade it until a much clearer signal is available - bulls seems adamant to want higher prices in the next few days

