$EUSTX50 at an important confluece point!Here are two possible scenarios:
If the price "respect" the trendline and the support it's a BUY.
If it breaks the trendline it's a Sell.
Either way we have a nice Risk/Reward ratio!
You can follow other indexes (such as DAX and S&P 500) as they are with a strong correlation this days.
Please leave your thoughts on the comments!
EU50 trade ideas


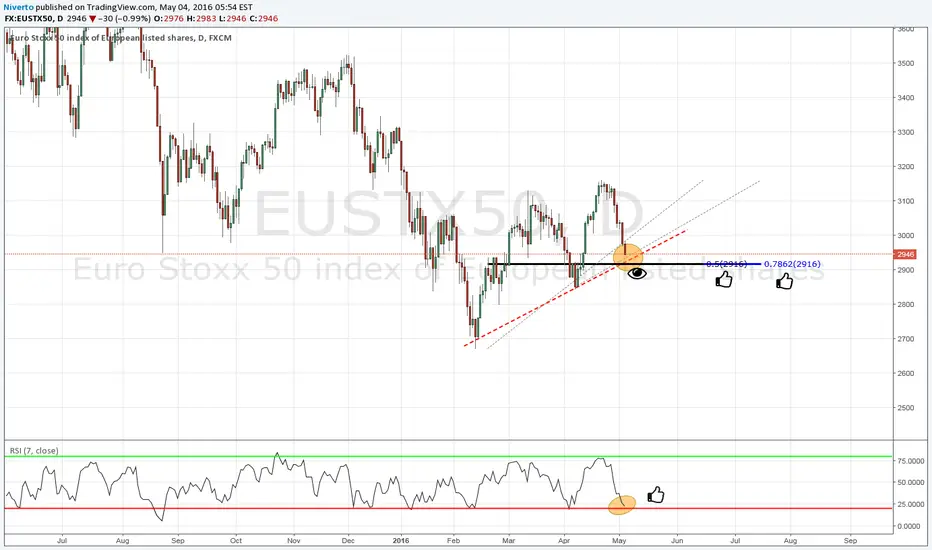
POTENTIAL BUY ZONE (confluence zone fib + RSI)Hi traders,
Price is approaching a nice confluence area with a perfect fibonacci confluence of 50% + 78.6% retracement aligned with the uptrend line. Note also the RSI approaching the oversold area.
I will look carefuly this zone and wait for a signal to go long.
Happy trading,
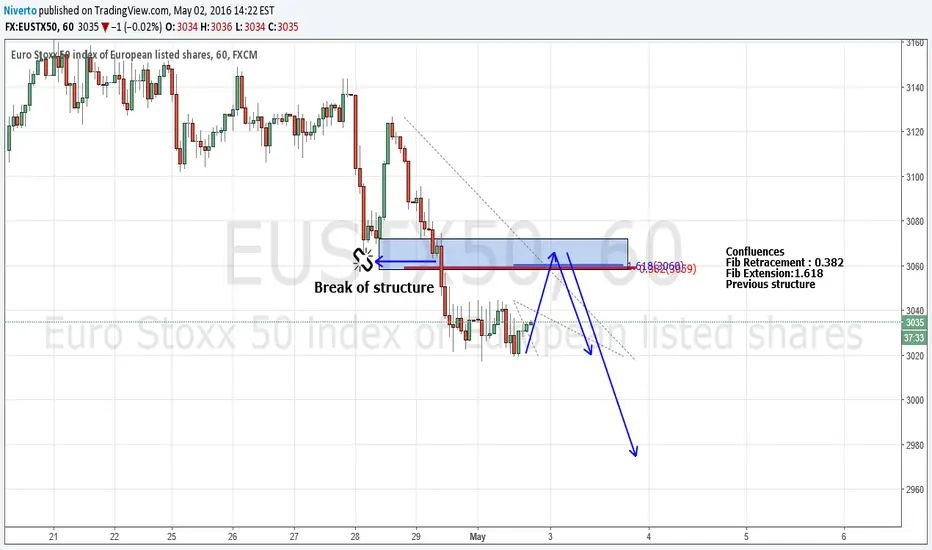
Trend continuation with Fib confluencesNice opportunity for bearish trend continuation.
See chart for full description.
Happy trading
SHS on Eurostoxx 50 As we can see Eurostoxx50 is making a S-H-S on 1 day time frame. This figure will end in same date that Brexit vote (aprox.) also we have the problem of Greece in June


STOXX50 / VSTOXXVSTOXX (Stoxx50 volatility index) is currently flirting with 4 months low level. STOXX 50 already started by touching top line of Bollinger band (20 days, 2 std dev). Comparing with S&P 500 and VIX (SP500 volatility index), we would also see +/- the same thing. Just be ready next week. Expecting at least 3% correction on STOXX50 in one of the days next week, as already quite clear with Saudi and Iran news development.


European stocks are turning bullish - ABC pattern?Weekly:
- Trend and Ichimoku setup is bearish. Key levels: 3100 / 3200-3250
- Heikin-Ashi candle and haDelta/SMA3 suggests a bullish price reversal is happening now
- EWO is bearish but value is less negative (ticking higher)
Daily:
- Ichimoku setup is turning bullish from neutral. Price made a decent dip in the Kumo, but could not deliver a bearish break. In case it clears Kijun and Kumo on the top side, buying will accelerate further.
- Market probably completed 5 bearish Elliott waves, and now we are in the A-B-C pattern phase, with third wave from B to C. Possible tgt is 3200-3250.
- Heikin-Ashi is bullish with increasing momentum! A close above 3000 will be a confirmation.
- EWO is ticking up to zero (neutral)
Strategy: Try to buy dips. Also Long Stoxx50 vs Short SP500 rel value trade can be a good risk reward. For sure it is not a good idea to short this mkt!


Bias is still bearishWeekly:
- Ichimoku Setup is bearish. Kijun refused 2 and 3 weeks ago.
- HA candles turned bearish. Acceleration expected below Tenkan (below 2900 spot)
- EWO has an important message: BEARISH! More important message: 1st and 3rd bearish wave was in. 5th is likely still ahead of us!
- Risk for bears: while it looks bearish now and it is prudent to sell and keep shorts, in case market fails ti break below weekly Tenkan, it can be squeezed up to 3250, before the 5th bearish wave really extends.
Daily:
- Ichimoku setup is neutral
- Heikin-Ashi has bearish bias.
- EWO back below zero! If stays red for few more days, it will be confirmed bearish again
- Bulls need to clear 3070, or they are lost. Bears real chance will come below 2900 (below Kumo), but first they minimum have to have a candle close below daily Kijun!


Euro stoxx 50 gooverextended in a sweeping downtrend to uptrend move, decent area of reaction, good for a quick daily trade

MOY0 Eurostoxx Daily MA TradeDon't do trend trading much anymore but getting into this for a short possibly down to 2650 or so

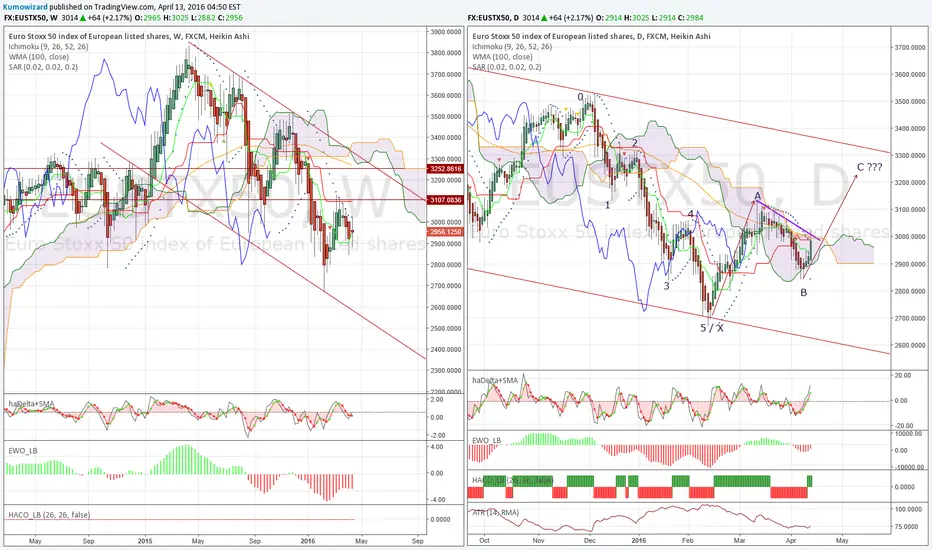
Confusing signals,but it's still just pull back in a #BEARMARKETWhen you have mixed and opposite signals in any instrument's longer and short term time frames, then you cen get confused. As my Heikin-Ashi mentor says, in these cases (of mixed signals between weekly and daily time frames) consolidation is likely to happen.
What I have to add is I always consider the longer time frame to be more powerful, relevant over the short term. So when I see clear counter trend against the higher time frame I try not to haunt for the top, but start watching for lower (daily) time frame sell signals and structure changes when I see higher (weekly) is reaching a key supp/res level.
This is exactly the case now with Euro Stoxx 50.
First please check how I warned you for a possible pull back and counter trend move 26 days ago! (hah, what a coincident, I love 26 days as in Ichimoku major average Kijun Sen has 26 days :-) )
This counter trend move is still intact, however on weekly chart, price is reaching a Bearish Support zone.
Weekly:
- Massive bearish channel
- Bearish Ichimoku setup.
- Heikin-Ashi shows counter trend pull back is in progress. However we have to see haDelta/SMA3 may peak this or next week! Early warning for possible momentum slow down in coming weeks.
- Price reaches Kijun Sen, as first bearish support. Possible resistance zone starts here. Obviously optimal sell level would more above 3200.
- Second and stronger resistance is 3250: 100 WMA, Spot Kumo, future Senkou B and bearish trendline.
- EWO is bearish. We likely saw wave 3, and we are in wave 4 now. Wave 5 still ahead, that would be the ultimate big short, targetting 2500 later this year.
Daily:
- Trend is bearish.
- Ichimoku is neutral with bullish bias. Chikou is above past candles. A break above Kumo will extend couter bullish move (ag. weekly chart)
- Heikin Ashi is bullish.
- Kijun Sen is far below Price, wait until it catches up. Right now no good risk/reward sell setup!
- Upper supp/res is 3250-3300, lower key is 2990.
- EWO is bullish
Obviously and oversoot above weekly Kijun Sen i spossible in coming weeks, but we already see that the strong bullish momentum will start to decline a bit. Wait until we see HA candle body shrink, and then check for Sell signal on the daily time frame.
Strategy:
1.Those who still hold counter longs should either buy a risk/reversal put option structure to protect profits, or start to think about scaling back position, or trail up stops.
2. Those who would like to sell this market short in line with major trend, I think have to wait a bit more, and watch developments as described above. No need to rush and get frustrated with taking position too early..


Possible cypher formation on the Euro Stoxx 50The support line on the downtrend was broken towards the end of February, and we are currently seeing a rally after the pullback.
Perfection of the black trend line crossing the triangle from the cypher.
If this rally continues to 3178 then we will have a cypher pattern completion and could go short.
Profit targets indicated by the green boxes. Stop loss indicated by the red box.


Your free Eurostoxx50 #Bearmarket guideWhen I mark this post as "SHORT", it doesn't mean to rush and sell now! It simply means we are in a confirmed bear market, which will be very volatile, and may provide some better short entries on bear market rallies.
Weekly:
- Bearish Ichimoku setup. Optimal sell area is ard Tenkan and Kijun: 2293 - 3093 zone.
- Heikin-Ashi calls for caution. Candle is still bearish, but haDelta could not make a lower low. Better sell opportunity would be at time, when haDelta gets closer to zero.
- EWO is bearish, it's lower level shows we'll soon have the low of 3rd Wave. That could be followed by few weeks of pull back, before the 5th wave hits mkt to a new lower low.
Daily:
- Wide bearish trend channel. Price made 5 waves from channel top to possible channel bottom between Dec/2015 and Feb/2016.
- Ichimoku is bearish, with important supp/res lvls at 2900 and 3090.
- Heikin-Ashi is in a counter bullish mode, but orice is still below Kijun Sen
- EWO reached an extreme low. Market is bearish, but there's good chance it has completed the 5th wave.
Bottom fishing on a bear market may work sometimes, but can be very dangerous if you dontt have a proper position sizing and tight stop loss.
For some more time this market will remain bearish. Of course bear markets have counter bullish waves too, which provide good sell opportunities. When you are uncertain, it is better to stay away, and wait for a better risk/reward entry point.


MOY0 - Eurostoxx 50 Monthly PictureMy long term view on Eurostoxx 50, (which is basically mirroring my view on many worldwide indices)
As per my previous posts on the Eurostoxx 50 index here:
I was shorting around 3780 looking for an 3 wave ABC retracement - which is near complete now...
There is a MAJOR fibonacci level around 2670 - 2630 comprising of:
- 61.8% retracement of the 2011 low and the 2015 high
- 88.6% retracement of the 2013 low to the 2015 high
- 0-A equal move B-C
- 161.8% fib external retracement of the A-B leg
A potential support zone still could offer some support at 2807, I will only enter here if a shorter term setup presents itself
Seeing there is 4x levels at a previous support zone I would not be surprised to see a rally from this level so will be scouring lower time frames to find a lower risk entry,
There is an unfilled gap at 3284, so will be targeting that level which is also the long term trend line
Indicators are near oversold territory and the RSI is still above 40 so at this stage it is still just a retracement in an uptrend

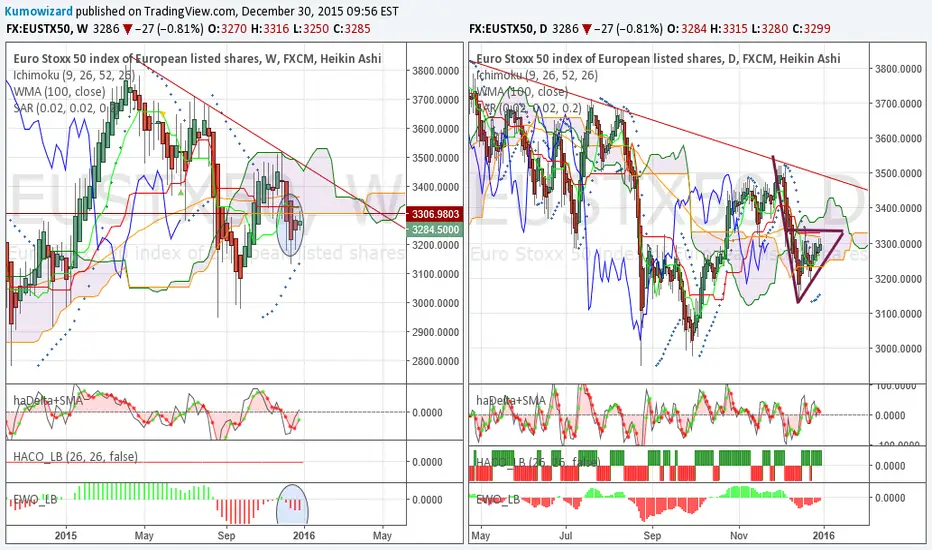
I don't want to cry wolf, but it just doesn't look healthy...Guys, this broader European equity index is sick!
Weekly:
- Bearish Ichimoku setup!!!
- Price action showed some correction in last few weeks, but momentum is extremely weak! Price could not move back above Kijun and into neutral Kumo zone. Smoothed haDelta still below zero line!
- EWO is bearish!
Daily:
- Year end saved by a neutral Ichimoku picture as Bulls managed to keep price within Kumo in a really choppy fight.
- Price action looks like a possible bearish flag for me! In case 3235 breaks, tgt will be sub 3000!
- Heikin-Ashi momentum is extremely weak: see candle patterns, small bodies and haDelta/SMA3
- EWO is close to zero, but still bearish!
I seriously have a feeling that we'll see a bearish action soon, in early 2016! So New Year will be happy... for the BEARS!