NASDAQ & NFP- I expect BullishnessHello fellow traders,
Today is NFP and I expect a bulishness as per my PD Arrays analysis. Lets se if it words out.
I have higlighted all important PD Arrays in my chart, keep an eye.
NAS100 trade ideas
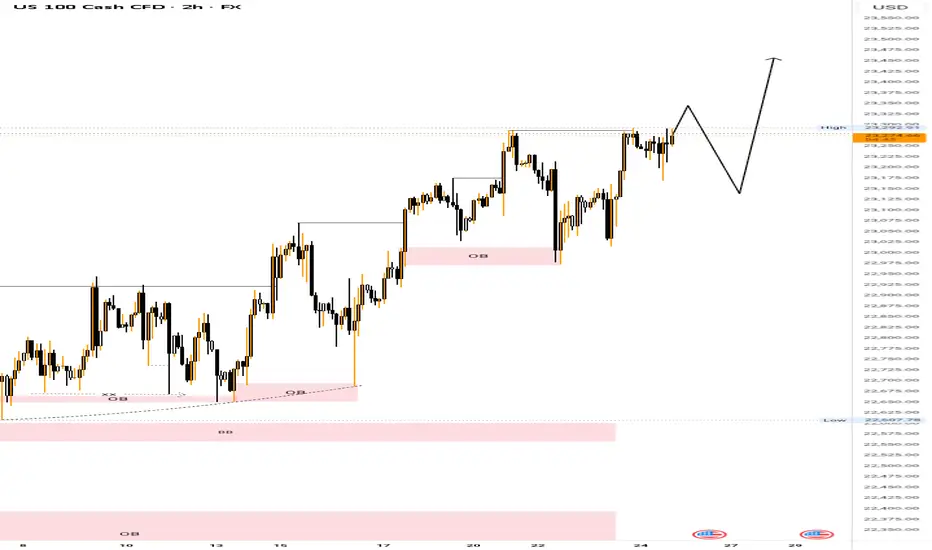
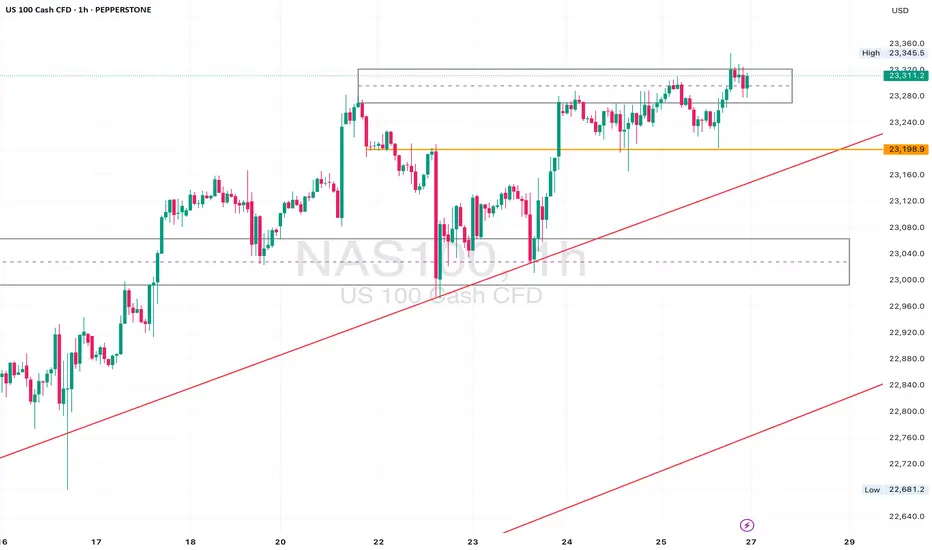
Possible direction bias on Nas100FX:NAS100 Now the price is still uptrending and those that think the price is high and want to sell might get their ass wipe. After the break of the current high, I expect a pullback to sweep the LIQ of the low that cause the break and then continue to the upside.
NAS100 - How will the stock market react to the FOMC meeting?!The index is trading above the EMA200 and EMA50 on the four-hour timeframe and is trading in its ascending channel. The target for this move will be the ceiling of the channel, but if it corrects towards the indicated support area, you can buy Nasdaq with better reward-risk.
As signs of easing global trade tensions begin to emerge, the Federal Open Market Committee (FOMC) is scheduled to meet this week. Analysts widely expect the Fed to hold interest rates steady for a fifth consecutive time. This anticipated decision comes as the U.S. President continues to push for rate cuts, persistently pressuring the Fed to adopt a more accommodative monetary stance.
So far, the Federal Reserve has kept its benchmark rate within a range of 4.25% to 4.5%. While some officials project two cuts by the end of the year, markets are waiting for the Fed’s patience to run out. According to the CME Group’s FedWatch tool, investors have priced in a 62% chance of a rate cut in the September meeting. By then, the Fed will have access to the July and August employment reports—key indicators of whether the labor market is weakening or remains resilient.
The upcoming week marks the peak of Q2 earnings season, with 37% of S&P 500 companies reporting results, including four major tech firms. In parallel, the August 1st tariff deadline for the EU and other countries is approaching, while legal challenges over existing tariffs remain ongoing.
According to a report by The Wall Street Journal, many large U.S. corporations have so far absorbed the bulk of tariff-related costs without passing them on to consumers. This strategy aims to maintain market share and avoid drawing criticism from President Trump. However, the question remains—how long can this continue?
Examples from the report include:
• General Motors paid over $1 billion in tariffs in Q2 alone without announcing any price hikes.
• Nike expects a $1 billion hit from tariffs this fiscal year and is planning price increases.
• Hasbro is working on a combination of price hikes and cost cuts to offset $60 million in tariff impacts.
• Walmart has made slight pricing adjustments (e.g., bananas rising from $0.50 to $0.54) and managed pressure through inventory reductions.
This week is shaping up to be one of the busiest on the economic calendar in recent months. A flood of key data on growth, inflation, and employment, alongside three major interest rate decisions, has markets on high alert.
On Tuesday, attention will turn to two significant reports: the Job Openings and Labor Turnover Survey (JOLTS) and the U.S. Consumer Confidence Index for July. These metrics will offer a clearer view of labor market dynamics and household sentiment heading into critical monetary policy decisions.
The most anticipated day is Wednesday. That day brings the ADP private payrolls report, the first estimate of Q2 GDP, and pending home sales data. Additionally, both the Bank of Canada and the Federal Reserve will announce rate decisions—events with the potential to simultaneously steer global market trajectories.
On Thursday, the July Personal Consumption Expenditures (PCE) price index will be released—a key inflation gauge closely monitored by the Fed. Weekly jobless claims data will also be published that day.
The week concludes Friday with two heavyweight economic indicators: July’s Non-Farm Payrolls (NFP) report, a crucial input for Fed policy decisions, and the ISM Manufacturing PMI, which offers insights into the health of the real economy.
Some economists argue that a September rate cut may be premature, and even suggest that no rate changes might occur in 2025. Analysts expect Fed Chair Jerome Powell to reiterate a data-dependent stance, consistent with previous meetings.
Still, beyond political dynamics, the July meeting holds independent significance.The Fed’s internal policy tone is gradually leaning more dovish, and subtle signals of this shift may emerge in the final statement. Given that only one meeting remains before September, if policymakers are leaning toward a rate cut then, it’s critical that the groundwork for such communication be laid now.
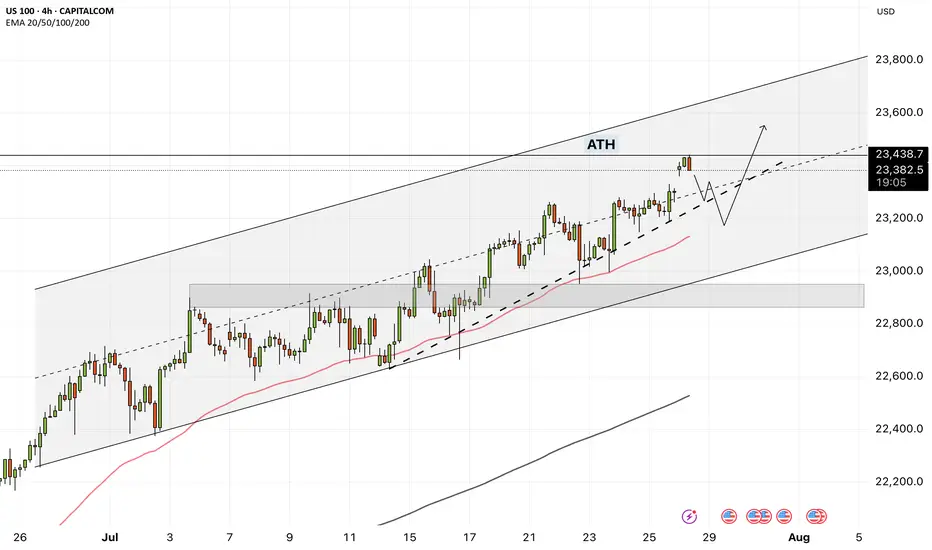
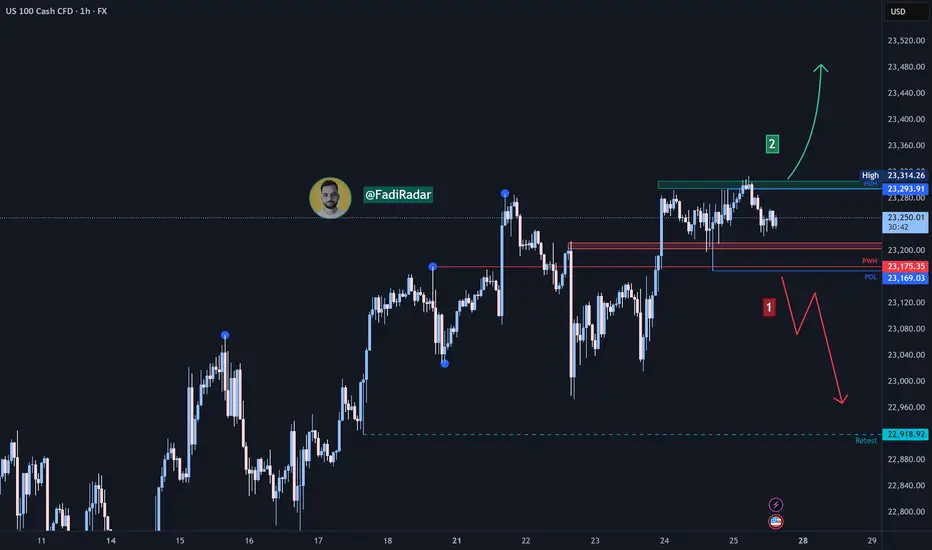
NAS100 Retesting Breakout – Eyes on 23170 for Bullish PushDaily Analysis:
Price is testing the upper boundary of the long-term ascending channel. Structure is still bullish with no major breaks of support. If momentum holds, we could extend toward the channel top.
4H Analysis:
Retesting breakout structure. Support is forming around 23000–23050. Bullish momentum remains valid unless price closes below this zone.
1H Analysis:
Micro-breakout confirmed with bullish impulse above 23120. If 23170 holds, continuation toward 23280–23320 is likely.
Confirmation & Entry:
Watch for continuation above 23170. SL below 23080. TP: 23280+
Use caution if 23000 breaks — this would weaken short-term bias.
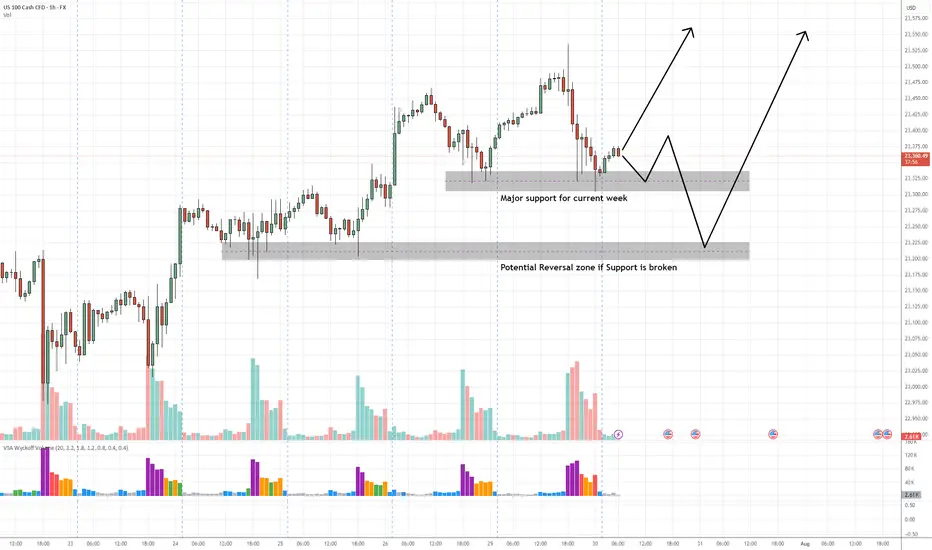
NAS100 Buy Setup – VSA & Multi-Zone Demand Analysis✅ Primary Entry Zone: Major support for current week (around 23,325–23,350)
✅ Secondary Entry Zone: Potential reversal zone if primary support is broken (around 23,200–23,230)
🎯 Target 1 (TP1): Previous swing high near 23,500
🎯 Target 2 (TP2): Extension above 23,550
🛑 Stop Loss (SL): Below 23,170 (beyond secondary reversal zone to avoid false breaks)
📊 Technical Insight (VSA & Price Action Structure)
Support Structure:
The current major support zone has been tested multiple times with no follow-through selling, indicating strong buying interest from larger players.
Volume Spread Analysis Observations:
On the recent decline into the major support zone, we see wider spreads on high volume followed by narrow range candles on lower volume, a classic sign of stopping volume and supply exhaustion.
Within the secondary reversal zone, historical reactions show climactic volume spikes leading to sharp reversals, suggesting this level is watched closely by smart money.
Any test back into the zone on low volume would confirm the No Supply (NS) condition.
Trade Pathways:
Scenario 1: Price respects the major support and begins to climb, confirming demand dominance → target TP1 then TP2.
Scenario 2: Support is temporarily breached, triggering a liquidity grab into the secondary reversal zone, followed by a bullish reversal bar on high volume → strong buy signal with potentially faster move toward TP levels.
📍 Bias: Bullish as long as price holds above the secondary reversal zone.
📌 Execution Tip: Wait for a wide spread up-bar on increased volume from either zone to confirm the start of the markup phase.
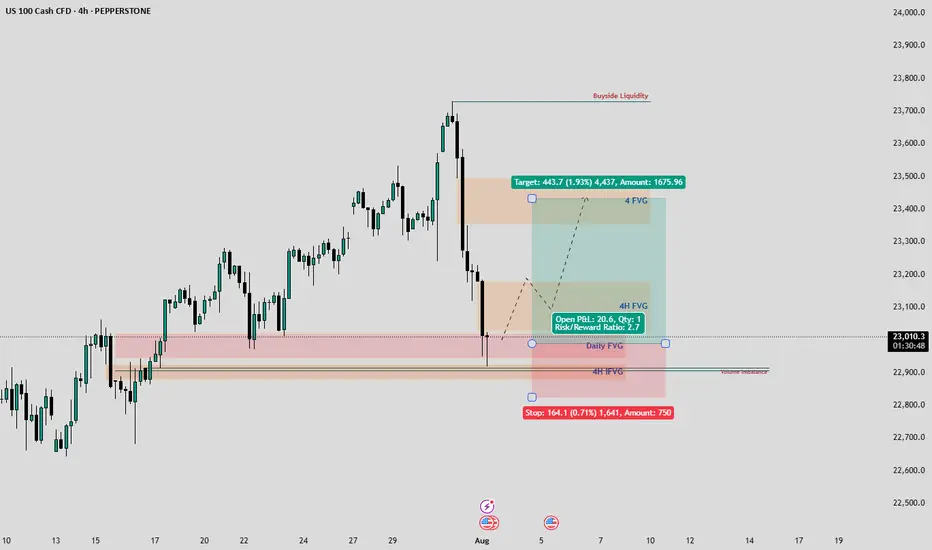
NASDAQ-Lets catch 250 Points togetherHello Fellow Traders,
Nasdaq has been wild since a time now. Today, I have spotted a rade to share with my fellow traders.
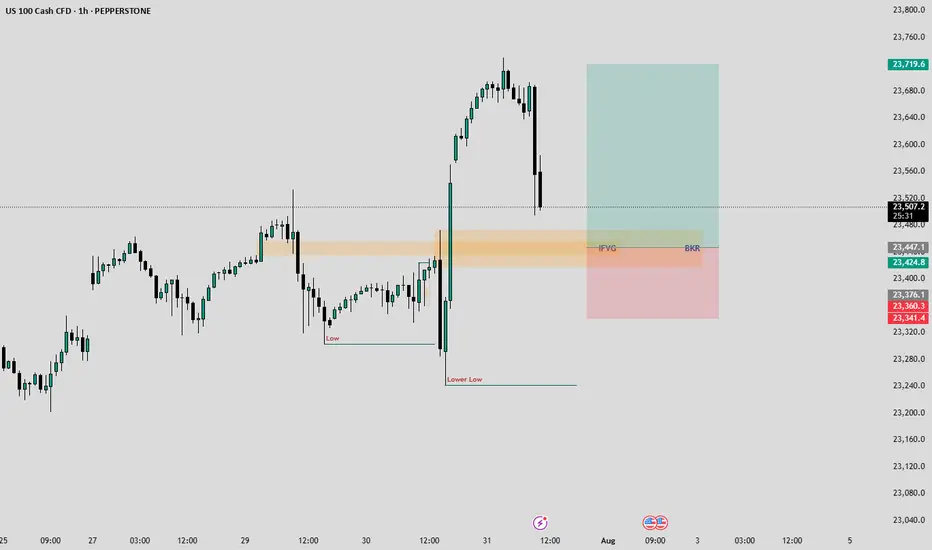
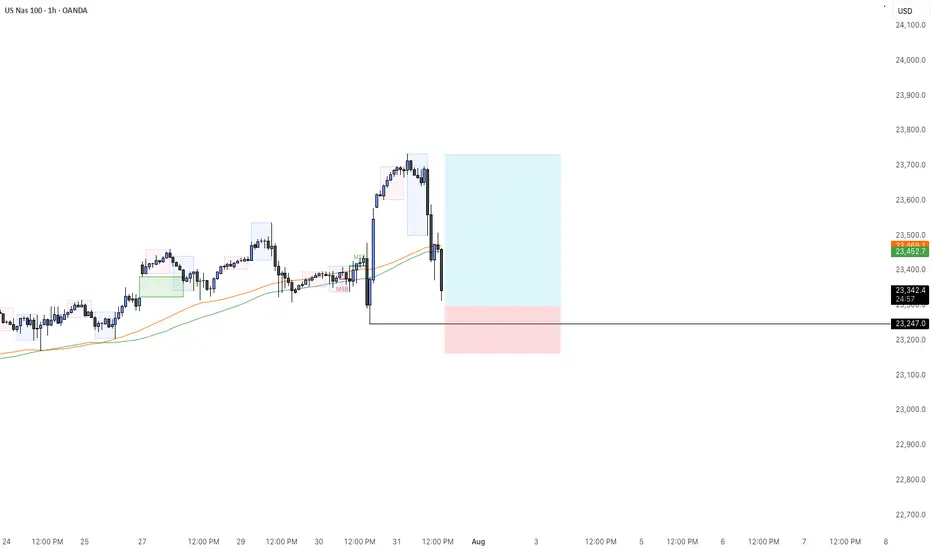
Yesterday closed with a good bullish candle. As the NY seesion has begun now, I am anticipating price to retrace to the highlighted breaker block that accurately aligns with an IFVG as well.
I am waiting for the price to fall into my area where I will monitor price's reaction, if we see signs of ejection from the highlighted areas, I wuld love to take a Buy Trade.
Entry= If rice enters the Breaker and IFVG and shows a good rejection.
SL= 23340
TP= Today's highs or 23700.
Manage your risk according toyour capital and only enter the trade if we happen to see a good rejection from the area. Be patient and don't hurry.
Nasdaq bearish nasdaq after taking out liquidity short term based and more bearish momentum can be expectected .
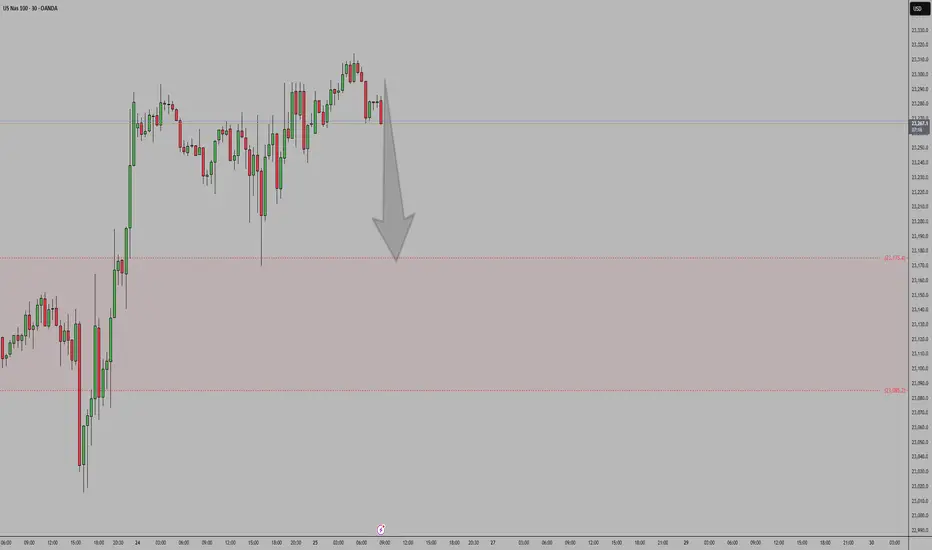
NAS100 - BUYHuge drop as expected today. Now that we are reaching its key level of interest, I will wait for a buy confirmation to take our last nights highs.
NAS100 Gaps Up on Trump Trade Deal – Bullish Continuation The market opened with a bullish gap after Trump announced new trade deals, sparking investor optimism. Price cleanly broke above the 23,266.5 🔼 resistance level, confirming it as a fresh support zone.
Buyers are now in full control, and price is forming a strong bullish structure with higher highs and higher lows.
Support at: 23,266.5 🔽, 23,200 🔽, 23,025 🔽
Bias:
🔼 Bullish: As long as price holds above 23,266.5, the path is clear for a move toward 23,400 and possibly 23,540+. Watch for minor pullbacks into support for continuation setups.
🔽 Bearish: A break back below 23,266.5 would be the first warning of bullish exhaustion, with downside potential toward 23,200.
📰 News Insight: The bullish gap came after Donald Trump announced new trade deals, boosting risk sentiment across U.S. indices. This has become a key short-term fundamental catalyst.
📛 Disclaimer: This is not financial advice. Trade at your own risk.

NASDAQ | BEARISHNASDAQ has retraced after hitting its top.A parabolic downward shift and an obvious bearish trend tend to print a LH.It may form an ABCD pattern and a sell stop order may be placed at the breakout of LL.

US100 Buy-Limit on Support 4HUS100 Buy-Limit on Support 4H
01-08-25
06:57 PM
Low Risk Trade because market is bearish!
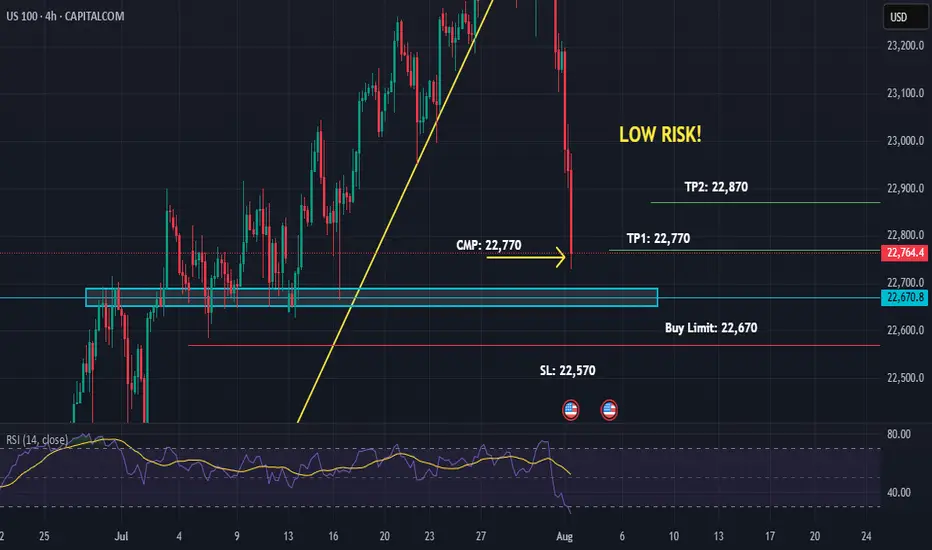
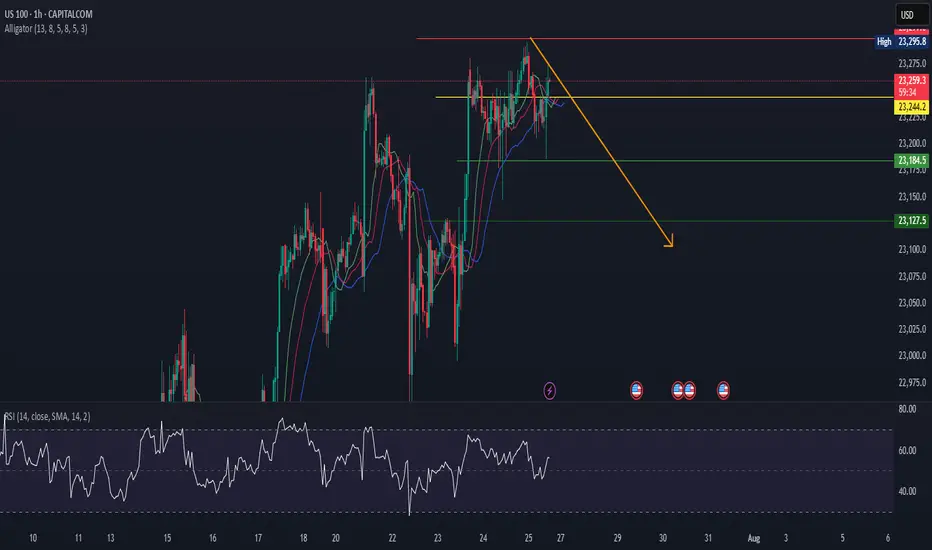
US100US100 is in reversal trend.
Alligator mouth is closed which shows trend will be reversal from here.
Divergence also indicates trend will go down
We sell at CMP.
Nasdaq Index Analysis (US100 / NASDAQ):The Nasdaq index continues its medium- to long-term uptrend and has recently reached a new high at 23,466 USD.
1️⃣ A break and close below 23,200 USD could lead to a pullback toward 23,000, followed by 22,920 USD.
2️⃣ However, if the price holds above 23,330 USD, further bullish continuation is expected, potentially leading to a new all-time high.
⚠️ Disclaimer:
This analysis is not financial advice. It is recommended to monitor the markets and carefully analyze the data before making any investment decisions.

Nasdaq is retracing to lower channal line.Nasdaq is retracing to lower channal line. This fall is attributed to Tarrif war.

NAS100 MAY FORM THE BEARISH HEAD AND SHOULDERS.NAS100 MAY FORM THE BEARISH HEAD AND SHOULDERS.
NAS100 has been trading sideways since the beginning of the week, forming local highs with lows staying at same price for the most part. The price seem to form the Head and Shoulders reversal pattern
What is a Head and Shoulders?
A Head and Shoulders pattern is a reversal chart pattern signaling a potential trend change. It consists of three peaks: two lower "shoulders" and a higher "head" in the middle, connected by a "neckline" (support level). A bullish (inverse) Head and Shoulders forms at a downtrend's end, signaling an uptrend; a bearish Head and Shoulders forms at an uptrend's end, signaling a downtrend.
Currently the SMA50 is pushing on NAS100 from above, while SMA200 is supporting the price. In case the SMA200 on 30-m minutes timeframe gets broken, we may see the decline towards 23,200.00 support level.

NASDAQ Bulls Pushing – Will 20,347 Hold or Break?Price is currently approaching the 20,347 🔼 resistance zone after a strong bullish rally from the 19,150 🔽 support level. The market structure remains bullish with consistent higher highs and higher lows, showing strong buyer momentum.
Support at: 19,670 🔽, 19,150 🔽, 18,500 🔽, 17,600 🔽
Resistance at: 20,347 🔼, 20,600 🔼, 21,000 🔼
Bias:
🔼 Bullish: If price breaks and holds above 20,347 🔼, we could see a continuation toward 20,600 and 21,000.
🔽 Bearish: A strong rejection from 20,347 🔼 could send price back down toward 19,670 and 19,150 for a retest.
📛 Disclaimer: This is not financial advice. Trade at your own risk.

Us100 short position 24/07/2025English : According to our analysis, we anticipate a bearish scenario.
Morocan Darija : kanchofo d'apres l'analyse dyalna antsanaw hboot
ATENTION : I only share my ideas, not signals
US100The US100, also known as the Nasdaq 100 Index, tracks the performance of the 100 largest non-financial companies listed on the Nasdaq Stock Exchange, primarily in the technology, consumer services, and healthcare sectors. It is a market-capitalization-weighted index and includes major corporations such as Apple, Microsoft, Amazon, NVIDIA, Meta, and Alphabet. As a tech-heavy index, the US100 is highly sensitive to changes in interest rates, innovation cycles, investor sentiment, and macroeconomic indicators, especially those related to inflation, employment, and monetary policy.
Over the past two decades, the Nasdaq 100 has experienced strong long-term growth, driven by the expansion of the digital economy, cloud computing, artificial intelligence, and e-commerce. After a steep correction in 2022 caused by inflation concerns and aggressive rate hikes by the Federal Reserve, the index rebounded in 2023 and 2024, supported by improving macroeconomic conditions, a stabilization in interest rates, and renewed investor confidence in tech and growth stocks. AI-driven investments, semiconductor breakthroughs, and tech-led productivity gains have further fueled its momentum.
As of August 2025, the US100 is trading at 22,747, marking a new historical high. This reflects strong earnings performance from major tech companies, continued innovation in AI and automation, and a more dovish outlook from the Federal Reserve, which has helped reduce pressure on growth equities. Despite its gains, the index remains vulnerable to volatility stemming from inflation surprises, geopolitical risks, and shifts in central bank policy. The Nasdaq 100 continues to be a key benchmark for growth-oriented investors and a barometer for the health of the global tech sector.

NAS100 steadies at high levels, pay attention nextThe most recent move on NAS100 saw a sharp drop that briefly recovered, likely triggering stops before aggressively reversing from the lower boundary of the newly projected channel. This isn't a cause for concern, on the contrary, it's another opportunity to get involved.
That is because this drop and recovery is a common behavior in strong uptrends before resuming bullish momentum.
The market is likely in the early stages of a new impulsive leg to the upside right here.
We could either have short-term consolidation or pullback, then a continuation toward the upper channel boundary or straight upwards, and with NAS100, the latter is more plausible.
My target will be at 23,300 around the upper boundary of the projected channel resistance.
In this context, the market remains bullish clearly. The most interesting aspect is the emotional flush on the last drop, trapping sellers before fueling what could be another big leg up.

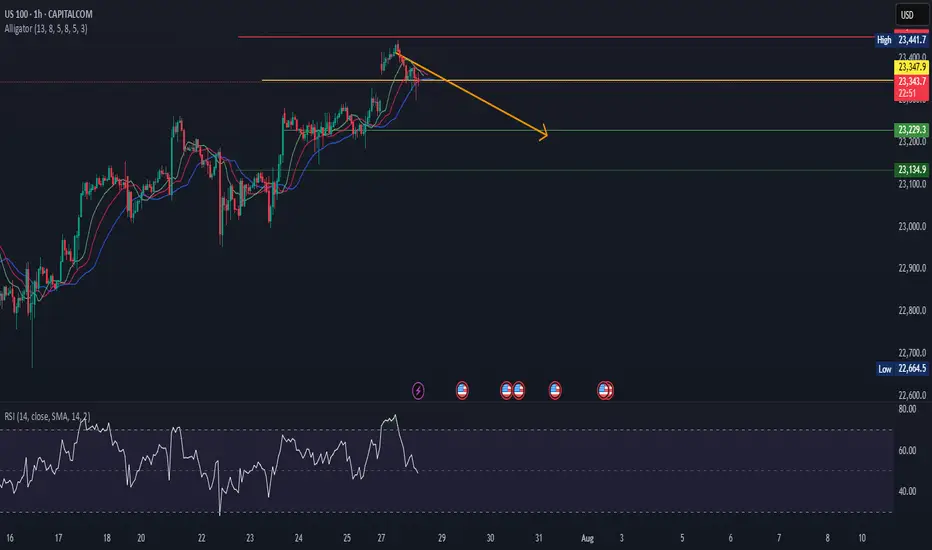
US100Us100 is in reversal MOde.
Big bearish divergence also shown in RSI.
Alligator alos indicates trend will go down from here.
we sell at CMP>
Nasdaq Index (US100 / NASDAQ) Technical Analysis:The Nasdaq index continues its medium- to long-term uptrend. Yesterday, it tested the 23,170$ level and rebounded upward, reaching 23,310$.
🔹 Bearish Scenario:
If the price breaks and closes below 23,200$, it may decline toward 23,000$, followed by 22,920$.
🔹 Bullish Scenario:
If the price holds above 23,300$, the uptrend is likely to continue toward a new high near 23,400$.
⚠️ Disclaimer:
This analysis is for educational purposes only and does not constitute financial advice. Always monitor the markets and perform your own analysis before making any trading decisions.
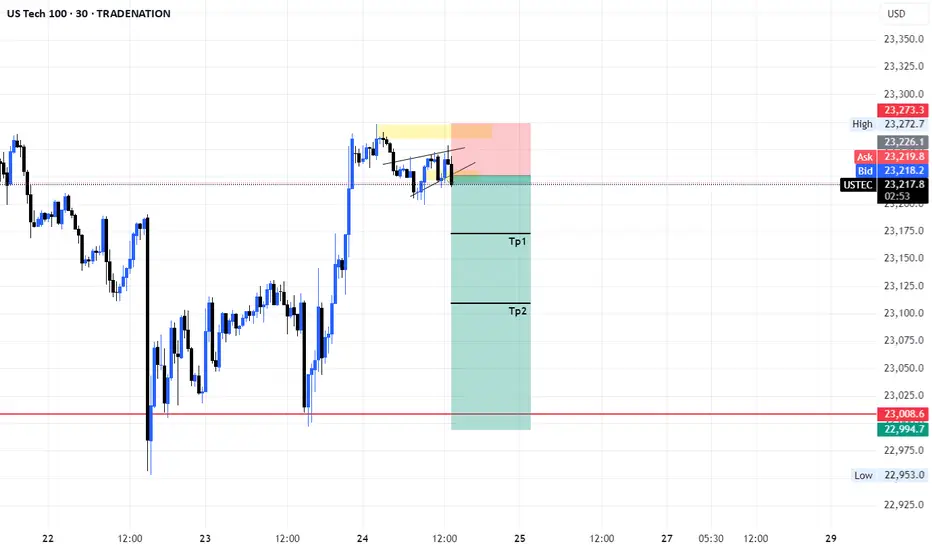
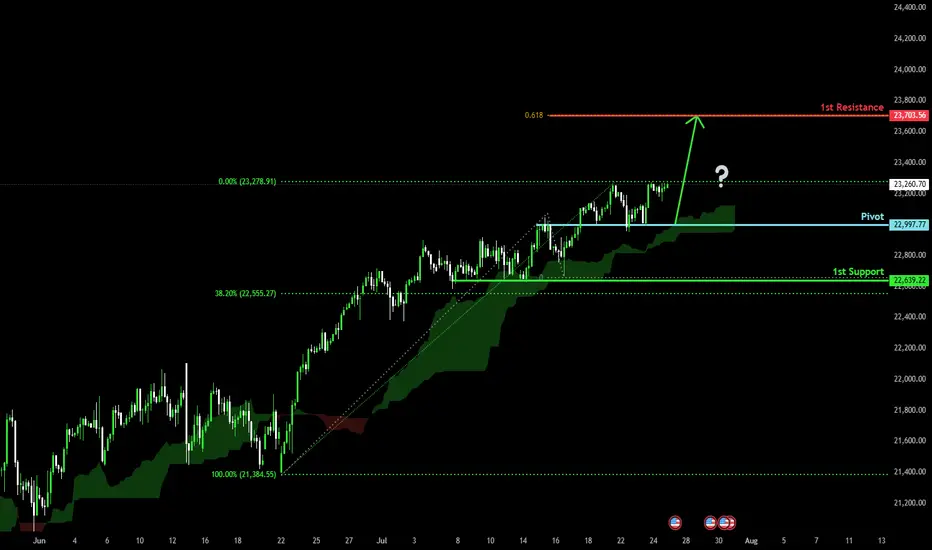
Bullish continuation?USTEC has bounced off the pivot and could potentially rise to the 1st resistancewhihc lines up with the 61.8% Fibonacci projection.
Pivot: 22,997.77
1st Support: 22,639.22
1st Resistance: 23,703.56
Risk Warning:
Trading Forex and CFDs carries a high level of risk to your capital and you should only trade with money you can afford to lose. Trading Forex and CFDs may not be suitable for all investors, so please ensure that you fully understand the risks involved and seek independent advice if necessary.
Disclaimer:
The above opinions given constitute general market commentary, and do not constitute the opinion or advice of IC Markets or any form of personal or investment advice.
Any opinions, news, research, analyses, prices, other information, or links to third-party sites contained on this website are provided on an "as-is" basis, are intended only to be informative, is not an advice nor a recommendation, nor research, or a record of our trading prices, or an offer of, or solicitation for a transaction in any financial instrument and thus should not be treated as such. The information provided does not involve any specific investment objectives, financial situation and needs of any specific person who may receive it. Please be aware, that past performance is not a reliable indicator of future performance and/or results. Past Performance or Forward-looking scenarios based upon the reasonable beliefs of the third-party provider are not a guarantee of future performance. Actual results may differ materially from those anticipated in forward-looking or past performance statements. IC Markets makes no representation or warranty and assumes no liability as to the accuracy or completeness of the information provided, nor any loss arising from any investment based on a recommendation, forecast or any information supplied by any third-party.
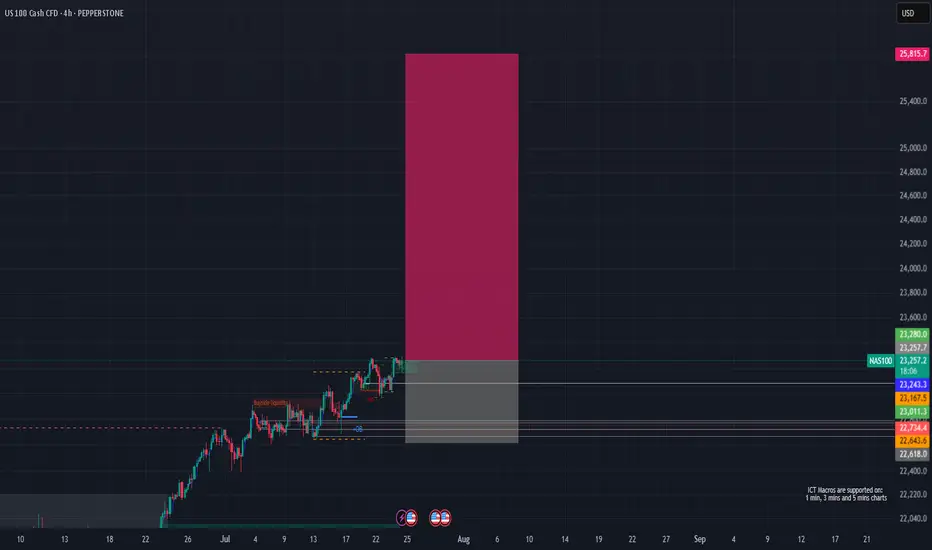
NAS100 (LONG IDEA)🟦 NAS100 (US Tech 100) – LONG SETUP 🟦
📅 Posted: 24 July 2025
🚦 Bias: BULLISH (Long)
🎯 Entry: 23,262 (market) or 23,170–23,250 (limit on dip)
🛑 Stop Loss: 22,617 (HTF structure protection)
🏁 Take Profits:
• TP1: 23,800
• TP2: 24,500
• TP3: 25,800
🔍 Technical Breakdown:
📈 Multi-Timeframe Confluence:
Monthly/Weekly/Daily: All show strong bullish structure, with price making new highs and respecting key demand zones.
4H/1H: Price is consolidating above a Fair Value Gap (FVG) at 23,170–23,250, showing strong demand and absorption.
🟩 FVG Support: 23,170–23,250 is the high-probability dip buy zone, aligning across all timeframes.
🟦 Structure: Higher highs and higher lows, with no signs of exhaustion.
🟢 Momentum: Bullish, with buyers stepping in on every dip.
🛡️ Invalidation: Clean break and close below 22,730 would invalidate the setup.
🔥 Fundamental & Sentiment Context:
💻 Tech/AI Leadership: US tech and AI stocks are driving index strength.
💵 Earnings Momentum: Strong earnings season, macro resilience.
🧑💻 Sentiment: Retail is long but not euphoric; institutions still net buyers.
🌍 Macro: No major headwinds; risk-on flows support further upside.
🛠️ Execution Plan:
💸 Buy now @ 23,262 or scale in on dips to 23,170–23,250 (FVG retest).
🛡️ Stop Loss: 22,617 (structure break).
🎯 Targets:
TP1: 23,800 (first liquidity target)
TP2: 24,500 (extension)
TP3: 25,800 (ATH zone)
⚡ Summary:
All signals GO! 🚦 Multi-timeframe bullish structure, FVG support, and strong momentum. Risk is well-defined below 22,730. Targeting new highs as tech/AI leadership continues.