US100 SELLERS WILL DOMINATE THE MARKET|SHORT
US100 SIGNAL
Trade Direction: short
Entry Level: 22,684.7
Target Level: 22,082.0
Stop Loss: 23,085.2
RISK PROFILE
Risk level: medium
Suggested risk: 1%
Timeframe: 10h
Disclosure: I am part of Trade Nation's Influencer program and receive a monthly fee for using their TradingView charts in my analysis.
✅LIKE AND COMMENT MY IDEAS✅
NAS100 trade ideas

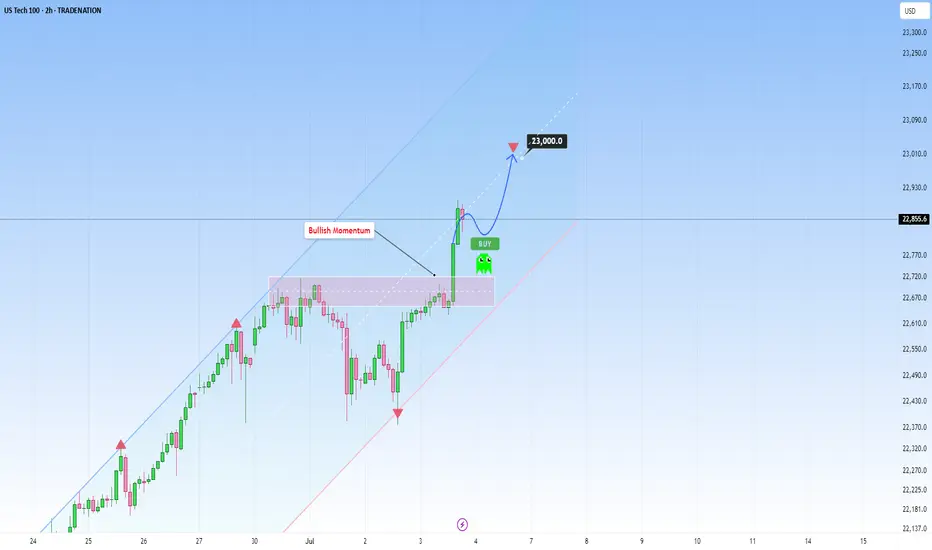
US100 rises sharply, with further upside target of 23,000At this stage, US100 continues to ride a dominant ascending channel structure, maintaining a consistent bullish structure supported by strong fundamentals as well as technical positioning.
The current price action reflects a high-confidence trend environment, underpinned by steady economic resilience in the U.S. tech sector and growing investor optimism surrounding AI-driven growth and corporate earnings. This alignment between structure and sentiment reinforces the strength of the current trend.
What’s especially encouraging is how the price has remained in the upper half of the ascending channel. Every corrective move has been shallow and absorbed quickly as well. This kind of behavior is exactly what you want to see in a strong trend.
From a structural perspective, the recent break of the prior swing high confirmed a bullish break of structure (BOS), reinforcing the broader uptrend. That’s a meaningful move, not just technically, but also psychologically, as it validates that bullish momentum remains intact and market participants are still positioning for higher levels.
No signs of weakness are showing up yet. If anything, the structure is intact and there’s no evidence of a shift in momentum. This makes it a good opportunity for traders who are "late to the party" to consider entering, as the trend still looks strong and continuation is likely.
As for upside targets, the 23,000 level is a natural extension. It aligns with the middle of the channel and fits within the current rate of expansion. If we don’t see any warning signs (like impulsive bearish candles), this target remains both technically justified and psychologically relevant.
Just sharing my thoughts on support and resistance, this isn’t financial advice. Always confirm your setups and manage your risk properly.
Disclosure: I am part of Trade Nation's Influencer program and receive a monthly fee for using their TradingView charts in my analysis.
NASDAQ 100 TRADING PLAN
⸻
🧠 US100 Multi-Timeframe Playbook
(W1 → D1 → H4 → M30 → M5)
⸻
🔹 Higher Timeframe Context
WEEKLY (Strong Uptrend):
• Key Levels:
– ATH supply: 22,800–23,000
– Support shelf (prior resistance): 22,100–22,200
– 50-SMA: 20,400
– 200-SMA: 16,100
• Summary: Bullish structure is intact as long as price holds above 22,100–22,200 and the long-term trendline.
DAILY (Bullish but stretched):
• Key Levels:
– Upper Bollinger Band: 23,025
– Mid-band & 20-SMA: 22,430
– 50-SMA: 21,985
• Summary: RSI at 66 and MACD > 0 but flattening. This suggests bullish momentum may be cooling — odds of a pause or pullback rising.
4-HOUR (Wedge – Late-Trend Exhaustion Risk):
• Key Levels:
– Rising wedge: upper rail ≈ 23,200, lower ≈ 22,450
– 8-EMA: 22,655 | 21-EMA: 22,425
– Anchored VWAP (from June low): 22,350
• Summary: Ribbon still bullish, but volume and MACD momentum are plateauing. A break below 22,450/VWAP confirms a corrective leg.
30-MINUTE (Neutral to Weak):
• Key Levels:
– Descending micro-trendline: 22,725
– Rising support: 22,690
– Session range: High = 22,845 | Low = 22,690
• Summary: Price is coiled near the apex. EMAs curling downward. Market decision point imminent.
5-MINUTE (Immediate Bear Bias):
• Key Levels:
– Live VWAP: 22,752
– 9-EMA sloping down
– Stochastic: mid-range
• Summary: Price remains below VWAP and 9-EMA. Short-term sellers in control unless VWAP is reclaimed.
⸻
📈 Trade Setups
1. Swing Long – Buy the Dip
• Let price wash through 22,450–22,350 (H4 wedge floor + VWAP zone)
• Enter if:
– 30m bullish engulfing or hammer closes back above 22,450
– AND 5m VWAP is reclaimed
• Initial Stop: Below liquidity sweep or 22,300 – whichever is lower – minus 0.25 × ATR(14, H4) ≈ 30 pts → around 22,270
• Targets:
– T1: 22,845
– T2: 23,200
– Leave runner for blue-sky continuation
• Comment: With weekly trend. Wait for deep retracement. Great RR ≈ 1:3+
⸻
2. Intraday Short – Mean Reversion
• Trigger Zone: 22,725–22,760 (broken trendline + 5m VWAP)
• Enter if:
– 5m rejection wick or bearish engulfing forms on avg+ volume
• Stop: Above 22,800 + buffer (≈ 22,820)
• Targets:
– T1: 22,600
– T2: 22,450
– Optional T3: 22,350 (VWAP)
• Comment: Counter-trend, so treat as scalp. Tight stops. Demand at least 1:2 RR.
⸻
3. Breakout Long – Trend Continuation
• Entry Criteria:
– 30m close above 22,845 with 150%+ average volume
– 5m bull flag holds above breakout level
• Stop:
– First 30m candle close back inside the range
– Or 22,770 (flag base) — whichever happens first
• Targets:
– T1: 23,025 (Daily BB)
– T2: 23,300 (measured move)
• Comment: Only take if strong volume confirms new participation. Avoid during Asia or illiquid hours.
⸻
⚙️ Execution & Risk Guidelines
• Risk per trade: ≤ 1% account (limit counter-trend trades to 0.5%)
• Sizing formula:
Contracts = Account Risk / (Stop pts × $ per pt)
• ATR reference:
– ATR(14, H4) ≈ 120 pts
– ATR(14, 30m) ≈ 80 pts
• Move stop to break-even once price moves 0.75 × stop distance in your favor
• Never run trades #2 and #3 at the same time → directional conflict
• Watch out for macro data (e.g., NFP, CPI) — can override intraday structure
⸻
⏱ What to Watch (In Sequence)
1. Overnight – Does price stay pinned below the 30m 21-EMA, or start to float above it?
2. London Open – First test of the 22,725–22,760 zone: fade or reclaim?
3. NY Open – Volume surge confirms either breakout (#3) or fade setup (#2)
4. End of Day – A close below 22,450 on volume = deeper pullback risk toward 22,000 next week
⸻
🔍 Final Thoughts
The trend is still your friend — but the daily and H4 chart are stretched. Let the trade come to you:
• Buy the flush only if we dip into confluence support and reclaim key levels (#1)
• Buy the breakout only if high volume confirms continuation (#3)
• Everything in-between is a scalp fade (#2) — execute cleanly, with defined risk, and respect trend structure.
This is for educational purposes. Fit these into your system and risk tolerance.
⸻

US100 - Reversal after liquidity sweep to target new highs?The chart presented shows a 1-hour analysis of the US100 (Nasdaq 100), illustrating a clean and structured price action narrative. Initially, we observe that the market swept liquidity at the lows, indicated by a sharp wick that pierced beneath the previous support levels. This type of liquidity sweep is common when smart money looks to grab stop-loss orders before reversing the trend.
Liquidity sweep to the downside
Following this liquidity sweep, price action aggressively moved upwards, breaking a lower high structure that had previously marked the bearish control of the market. This break of structure is a key bullish signal, suggesting a shift in momentum from bearish to bullish, and often signifies the beginning of a new upward leg.
1H FVG
An important element on this chart is the 1-hour Fair Value Gap (FVG), initially acting as a bearish imbalance. However, due to the strong bullish momentum, price not only reclaimed this level but did so decisively. As a result, this bearish FVG is now considered a bullish FVG, indicating that it may serve as a support zone on any short-term pullback.
Liquidity taken from the upside
After reclaiming the FVG and breaking structure, price surged further, taking out upside liquidity just above recent highs. This action typically leads to a short-term pullback, as profit-taking and new supply enter the market. The chart suggests that any retracement may find support at the 1H FVG, providing a potential entry point for bullish continuation.
Conclusion
In conclusion, the US100 demonstrated a textbook liquidity grab at the lows, followed by a break in bearish structure, a shift in momentum, and an inversion of a key FVG zone from bearish to bullish. The short-term upside liquidity has been cleared, and the next logical target is the high marked on the chart. Should the price respect the newly formed bullish FVG on any pullback, we can expect continuation toward that upper high, completing the bullish run.
Disclosure: I am part of Trade Nation's Influencer program and receive a monthly fee for using their TradingView charts in my analysis.
Thanks for your support.
- Make sure to follow me so you don't miss out on the next analysis!
- Drop a like and leave a comment!

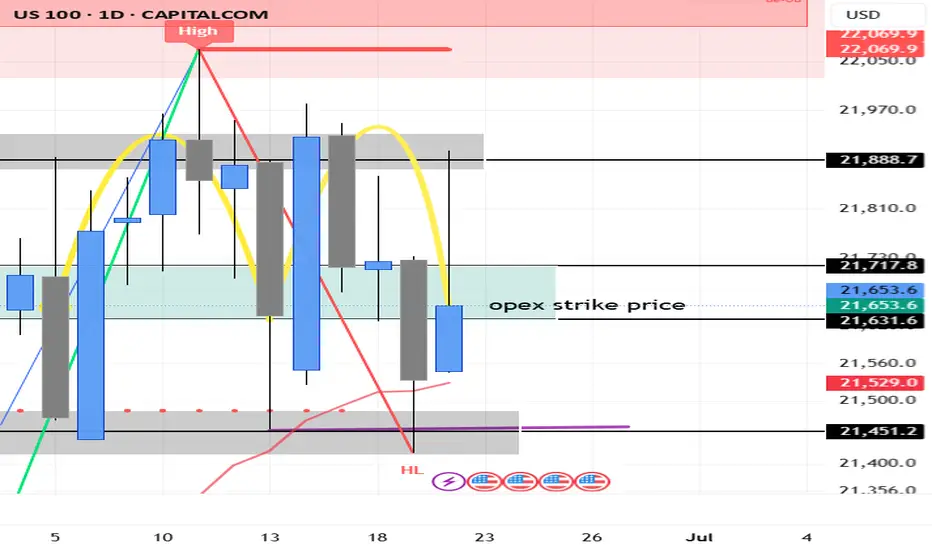
Nasdaq ready for pullback??Hi Guys,
The US indices have been ripping back to all time highs without any meaningful pullbacks from the lows.
The Nasdaq is approaching a price level where we may see a pullback and some selling pressure.
The shaded box above the chart is that area and it contains two important fib levels. The bottom of the box is the 1.13 retracement of the recent high to the low after the tarrif news. The black line drawn through the box is the 2.0 retracement of the bear market high to low. This level is always important but it is more significant in this case because the SP 500 and Dow Jones both had the big drops from pretty much exactly this level. The Nasdaq failed to reach this level so if the other two indices are anything to go by we may see some selling here.
Daily RSI is showing divergence. Sell setups using break of structure chart pattern and candlestick patterns on lower time frame could result in nice risk to reward trades.
The red line coming from the bottom is the AVWAP and its no coincidence that it is in line with a n obvious support area should we get a deep enough pullback.
Safe Trading all

#NDQ - Monthly Targets: 23721.73 or 21387.86?Date: 03-07-2025
#NDQ - Current Price: 22641.89
Pivot Point: 22554.80 Support: 22276.15 Resistance: 22835.11
Upside Targets:
Target 1: 23028.36
Target 2: 23221.62
Target 3: 23471.67
Target 4: 23721.73
Downside Targets:
Target 1: 22082.06
Target 2: 21887.98
Target 3: 21637.92
Target 4: 21387.86

NASDAQ Bulls Defend Pivot – Can 23,000 Break Next?USNAS100
The Nasdaq 100 is currently holding above the pivotal 22,720 level, supported by market optimism amid recent tariff-related developments from the White House.
Bullish Scenario:
Sustained price action above 22,720 keeps bullish momentum intact. A break and 1H close above 22,815 would confirm strength, opening the path toward the psychological milestone and potential all-time high at 23,000.
Bearish Breakdown:
A 1H or 4H close below 22,720 would invalidate the bullish bias and strengthen downside pressure, with initial support seen at 22,615 and deeper correction likely toward 22,420.
Key Technical Levels:
• Resistance: 22,815 · 23,000
• Support: 22,615 · 22,420

Bollinger Bands: How to Stop Being a Slave to the Markets.Bollinger Bands are a technical analysis indicator widely used in trading to assess the volatility of a financial asset and anticipate price movements. Created in the 1980s by John Bollinger, they consist of three lines superimposed on the price chart:
The middle band: a simple moving average, generally calculated over 20 periods.
The upper band: the moving average to which two standard deviations are added.
The lower band: the moving average to which two standard deviations are subtracted.
These bands form a dynamic channel around the price, which widens during periods of high volatility and narrows when the market is calm. When a price touches or exceeds a band, it can signal an overbought or oversold situation, or a potential trend reversal or continuation, depending on the market context.
What are Bollinger Bands used for?
Measuring volatility: The wider the bands, the higher the volatility.
Identify dynamic support and resistance zones.
Detect market excesses: A price touching the upper or lower band may indicate a temporary excess.
Anticipate reversals or consolidations: A tightening of the bands often heralds an upcoming burst of volatility.
Why is the 2-hour time frame so widely used and relevant?
The 2-hour (H2) time frame (TU) is particularly popular with many traders for several reasons:
Perfect balance between noise and relevance: The H2 offers a compromise between very short time frames (often too noisy, generating many false signals) and long time frames (slower to react). This allows you to capture significant movements without being overwhelmed by minor fluctuations.
Suitable for swing trading and intraday trading: This TU allows you to hold a position for several hours or days, while maintaining good responsiveness to take advantage of intermediate trends.
Clearer reading of chart patterns: Technical patterns (triangles, double tops, Wolfe waves, etc.) are often clearer and more reliable on H2 than on shorter time frames, making decision-making easier.
Less stress, better time management: On H2, there's no need to constantly monitor screens. Monitoring every two hours is sufficient, which is ideal for active traders who don't want to be slaves to the market.
Statistical relevance: Numerous backtests show that technical signals (such as those from Bollinger Bands) are more robust and less prone to false signals on this intermediate time frame.
In summary, the 2-hour time frame is often considered "amazing" because it combines the precision of intraday trading with the reliability of swing trading, thus providing superior signals for most technical strategies, particularly those using Bollinger Bands.
To summarize
Bollinger Bands measure volatility and help identify overbought/oversold areas or potential reversals.
The 2-hour timeframe is highly valued because it filters out market noise while remaining sufficiently responsive, making it particularly useful for technical analysis and trading decision-making.

NASDAQ After the Fireworks: Bearish Setup LoadedAfter the classic 4th of July rally, I stepped in on the short side of Nasdaq, targeting 22,000 and 21,400 zones. The market structure shows exhaustion, and with the cloud retest failing to hold new highs, I positioned accordingly.
Technical:
• Price stalled at prior expansion highs with tight compression near 23,000.
• Daily FibCloud offered resistance confirmation.
• Bearish risk-reward skew forms after extended rally and thin retraces.
• Volume divergence spotted.
Fundamentals:
Multiple overlapping uncertainties:
• Trump confirmed tariffs will take effect on August 1, threatening a 10% surcharge on BRICS-aligned nations.
• Treasury Secretary Bessent anticipates several trade deal announcements within 48h—but stresses quality over quantity.
• Bank of America maintains its base case of 0 rate cuts in 2025, citing strong economic data and sticky inflation risks.
The combination of tariff escalation, hawkish monetary expectations, and global trade friction creates a perfect backdrop for volatility and correction—especially in overextended tech indices like the Nasdaq.
Note: Please remember to adjust this trade idea according to your individual trading conditions, including position size, broker-specific price variations, and any relevant external factors. Every trader’s situation is unique, so it’s crucial to tailor your approach to your own risk tolerance and market environment.

Technical Analysis – NAS100 (15min)Chart Overview Date: July 7, 2025
Market: NAS100 (US Tech 100 Index)
Timeframe: 15-Minute
Chart Context: Clean with Price Action Focus
🧠 Market Structure
Overall uptrend structure since June 21st – higher highs and higher lows.
Key resistance zone: 22,900 – price was rejected here multiple times.
Support area: 22,500 – formed after bullish impulsive move and retest.
🎯 Entry Scenario
Currently in a sideways consolidation between 22,700 – 22,900.
A break above 22,900 with strong volume can lead to a bullish continuation.
Alternatively, a rejection near 22,900 with bearish engulfing candle may offer a short scalp back toward 22,700.
📈 Bias & Confirmation
Trend Bias: Bullish
Wait for:
Breakout and close above resistance for long.
Rejection and bearish signal at resistance for short.
📌 Plan
Type Trigger SL TP Target 1 TP Target 2
Long Break & close >22,900 <22,800 23,050 23,150
Short Rejection @22,900 >22,950 22,720 22,600
"📊 Clean and structured technical analysis on NAS100 – Currently consolidating after a strong uptrend. Watching key levels around 22,900 for breakout or rejection scenario.
Trade safe. 📈 #ALIPFX #TechnicalAnalysis #NAS100"

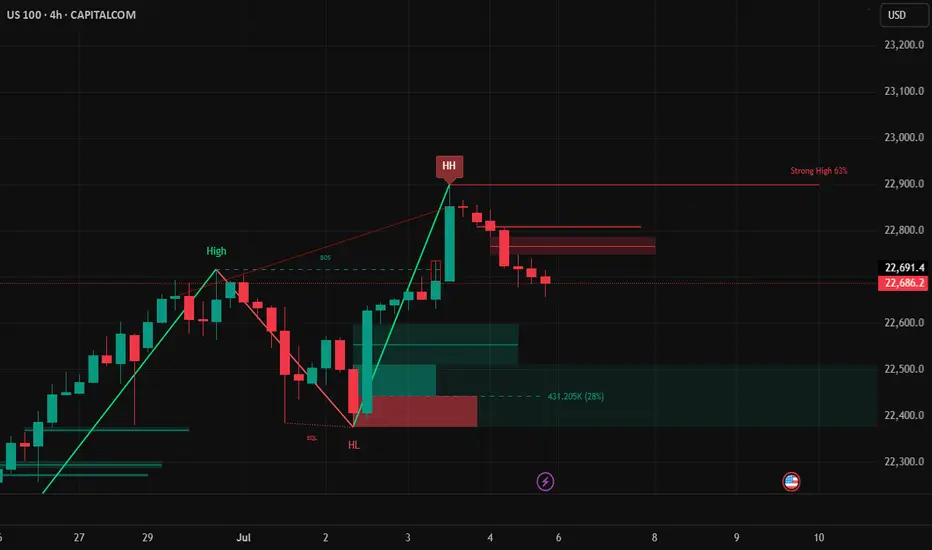
Nas Long to clear HH liquidity before correctionHTF Context – Monthly / Weekly / Daily
• Big Beautiful Bill (Trump Tax + Spending Bill)
o Passed July 4th, acting as a stimulus.
o Markets historically rally on fiscal stimulus expectations (tax cuts + spending packages).
o This fuels bullish sentiment short-term, but long-term raises debt, inflation risk, and rate hike concerns.
• Seasonality
o July is typically strong for equities, especially tech, with mid-July often marking local tops before August pullbacks.
• Monthly structure
o Strong bullish monthly candles.
o Next major fib retracements if rejected: 38.2% ~20,398, 50% ~19,625, 61.8% ~18,852.
• Weekly / Daily structure
o HH-HL sequence continues.
o Price in premium zone, approaching major supply block 23,200–23,300.
o Daily BOS not broken downwards yet.
________________________________________
Key Levels
• Major supply / liquidity magnet: 23,200–23,300 (sell-side OB in futures, uncollected liquidity above HH)
• Recent swing high: 22,900
• Daily pivot: 22,470
• Intraday demand zone: 22,450–22,350 (4H wedge base + VWAP)
• Weekly support shelf: 22,100–22,200 (if lost, major trend shift bearish)
________________________________________
My View – Most Likely Path
1. Price is likely to sweep the liquidity above recent highs into the 23,200–23,300 supply zone.
o Why? Market rarely leaves liquidity uncollected. This move traps breakout buyers and hits stops above HHs.
o Big Beautiful Bill fuels the final squeeze higher as algorithms price in fiscal stimulus.
2. After liquidity sweep above 23,200–23,300:
o Expect strong rejection from that zone.
o Institutions offload positions into trapped retail longs.
o Price pulls back towards daily and weekly support zones for reaccumulation.
3. Alternate scenario (less likely)
o Immediate sell-off from current levels without sweeping HH.
o Weak move; would still expect a revisit higher later to clear liquidity before a proper downtrend.
________________________________________
Trade Setups – Intraday & Swing
Intraday Long (Most Likely)
• Bias: Bullish continuation
• Entry Zone: 22,450–22,350 (4H demand + VWAP)
• Trigger: 5m/15m BOS up
• Stop: Below 22,300.
• Targets: First at 22,615, next at 22,845, final at 23,200–23,300.
________________________________________
Intraday Short (Countertrend / Liquidity Sweep Reversal)
• Bias: Short from supply after liquidity grab
• Entry Zone: 23,200–23,300
• Trigger: Sweep of HH with rejection wick or bearish engulfing candle
• Stop: Above 23,350 (structure invalidation).
• Targets: First at 22,845, then 22,600, extend to 22,450 if momentum accelerates.
________________________________________
Swing Long (Continuation)
• Bias: Bullish trend intact
• Entry: After retest of daily pivot (22,470) or 4H demand (22,350–22,450) with 4H CHoCH + BOS up.
• Stop: Below 22,200 (weekly support break invalidates).
• Targets: 22,845 then 23,200–23,300. Blue sky if above.
________________________________________
Swing Short (Only if structure breaks)
• Trigger: Daily close below 22,200
• Bias: Bearish trend shift
• Targets: 21,800 first, then 21,000 major fib cluster and weekly MA.
________________________________________
Summary – My Final Opinion
Price is in a strong uptrend fuelled by fiscal stimulus, rate cuts and tarrif hopes . I think it will sweep the liquidity above 23,200–23,300 before any deeper pullback or trend reversal. Any rejection from that supply zone will be the cue to short for a structural retracement. Until then, I’ll keep buying dips aligned with the HTF bullish structure.
NAS100 CAUTION - Realistic Perspective!!Dear Friends in Trading,
How I see it,
This rising channel represents severe overbought greed territory.
A very big correction might be around the corner or in the near future.
Daily and Weekly RSI Divergence could be forced to re-balance at any time.
Keynote:
This is not a contradiction of my previous NASDAQ post.
Short-Term strong bullish price action can still prevail.
But please keep this big picture in mind from here on end.
Feel free to ask questions if anything is unclear.
I sincerely hope my point of view offers a valued insight.
Thank you for taking the time to study my analysis.

NASDAQ | - Structure Refined | Bullish Intent Into Next WeekPair: NAS100
Bias: Bullish
Timeframes: 4H, 2H, LTFs
• 4H broke structure to the upside with a new HH — clear sign of bullish intent stepping in.
• 2H gives clarity on the move — beginning of the week was messy, but price cleaned up nicely and gave us refined structure to work with.
• Now we wait for mitigation into the OB zone to see if price respects and gives us the setup.
🔹 Entry: After price mitigates OB and confirms with CHoCH on LTFs
🔹 Entry Zone: Marked OB zone — wait for confirmation
🔹 Target: Near structure highs — continuation if bulls step in
Mindset: Messy beginnings don’t mean bad outcomes. Structure eventually reveals the truth — just stay patient and ready.
Bless Trading!

Nasdaq Approaches 23,000 Mark for the First TimeOver the past five trading sessions, the U.S. Nasdaq index has posted a gain of more than 1.5%, supported by a recent rise in market confidence that has pushed the equity index to new all-time highs. The NFP employment data released yesterday surprised markets with 147,000 new jobs, compared to the 111,000 expected, reflecting a recovery in the labor market that could ultimately support domestic consumption in the U.S.. This has helped maintain investor confidence in equities, supporting a bullish bias in the Nasdaq in recent sessions.
Sustained Uptrend
Since the early days of April, the Nasdaq has maintained a solid upward trend, with no relevant signs of selling pressure that would threaten the current bullish structure. As a result, the long-term bias remains clearly bullish within the broader market outlook. However, it's worth noting that a growing sense of indecision has emerged in recent sessions, reflected in the candlestick patterns, which could open the door to short-term bearish corrections.
Technical Indicators
MACD: The MACD histogram continues to hover around the neutral zero line, indicating a balance in moving average strength during recent sessions. If this pattern continues, it may result in a more defined period of price neutrality in the short term.
RSI: The presence of consistent RSI highs, alongside higher price highs in the Nasdaq, has led to the formation of a bearish divergence. This suggests that market equilibrium has been affected by recent bullish momentum, and could lead to price pullbacks in the upcoming sessions.
Key Levels to Watch:
23,000 – Psychological barrier: A tentative resistance level in the short term due to the lack of clear technical references. A breakout above this level could reinforce the current bullish bias and signal a more sustained upward trend.
21,800 – Nearby support: An area aligned with a recent neutral technical zone, which may act as relevant support in the event of a short-term pullback.
21,000 – Key support: A level that coincides with the 50-period simple moving average. A break below this level could put the current bullish structure at risk and pave the way for a more significant downward move.
Written by Julian Pineda, CFA – Market Analyst

USNAS100 Key Level: 22,740 – Will the Trend Continue or Reverse?USNAS100 Update – Bullish Momentum Holds Above 22,740
USNAS100 has continued to push higher, following through as expected from yesterday’s analysis.
The index maintains bullish momentum as long as it trades above the key pivot at 22,740.
However, a 1H close below 22,730 could trigger a bearish correction toward 22,615.
A sustained break below that level may shift the trend to bearish.
Key Levels:
• Resistance: 22,870 / 23,000
• Support: 22,615 / 22,410

NAS100 High-Risk Momentum Play with Potential H&S SetupNAS100 is hovering near all-time highs. While a retest of the weekly trendline remains likely, this idea aims to ride the current bullish momentum. The plan anticipates a short-term pullback to recent lows to potentially form a head and shoulders pattern before a move lower toward the weekly trendline. This is a high-risk setup I’d typically avoid, but the strong bullish weekly close adds some weight. Two entries provided - one with a tighter TP for a quicker reaction.

Pullback before next leg up
NASDAQ’s looking weak short term. We’ve seen multiple rejections from the highs, an M pattern forming on the daily, and RSI divergence creeping in on the daily — momentum is clearly fading. I already took profit around 21980. And a few small swings between the range since 3rd of June.
The rally off the tariff drop was sharp, but it feels mechanical. Bulls look tired here. You can see price is stalling — pushing into the same highs but getting nowhere. Classic signs of distribution.
That said, this isn’t the start of a full-blown bear market. The long-term trend remains bullish. AI investment is still piling into the U.S., tech’s still leading globally, and structurally we haven’t broken down yet. Some weakness is starting to show though.
But short term, I think we see a pullback. The Fed’s still sitting on the fence with rate cuts, which is creating uncertainty. Add that to the current geopolitical tensions, and there’s enough on the table to justify a temporary risk-off move.
If price breaks and closes above 21,860, I’ll reassess and potentially shift back to a bullish bias. Until then, I’m leaning short and letting price action do the talking.
My key downside levels:
TP1: 21,483 — scale out and protect.
TP2: 21,322 — potential bounce from this area.
TP3: 21,145 — structure starts to weaken.
TP4: 20,894 — bears starting to control and a deeper flush, I’ll reassess bias at this level.
SL @ 21850 on my second entry short
Short term: pullback likely.
Big picture: still bullish — but bulls need to reset before any next leg up.
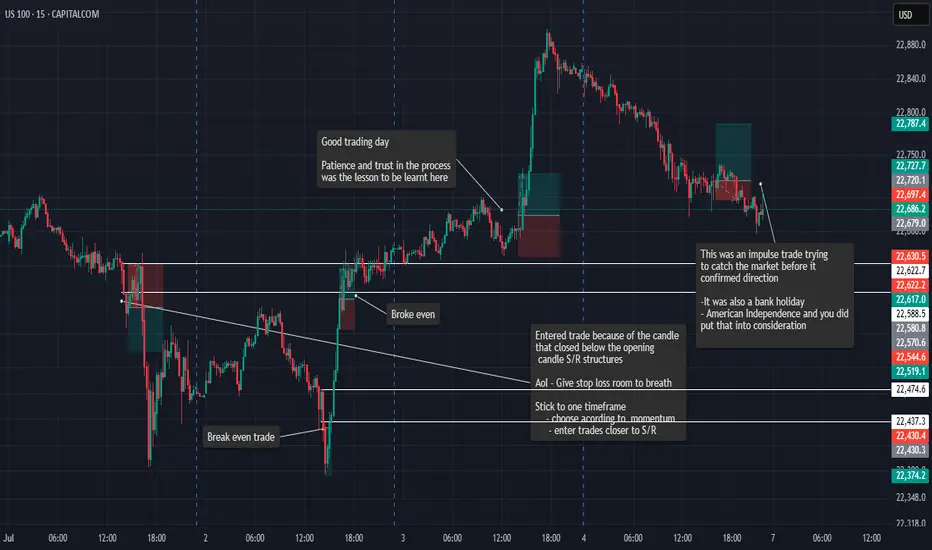
Last Weeks Trades and AnalysisWeek 1 - Trade reviews
This is a look back at the trades i tooks and the lessons taken from that day, More information is in my trading journal
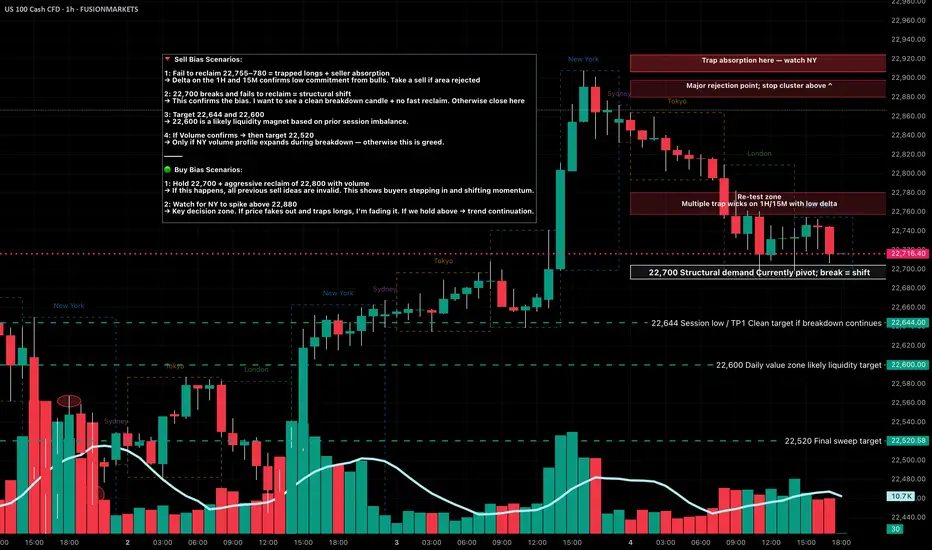
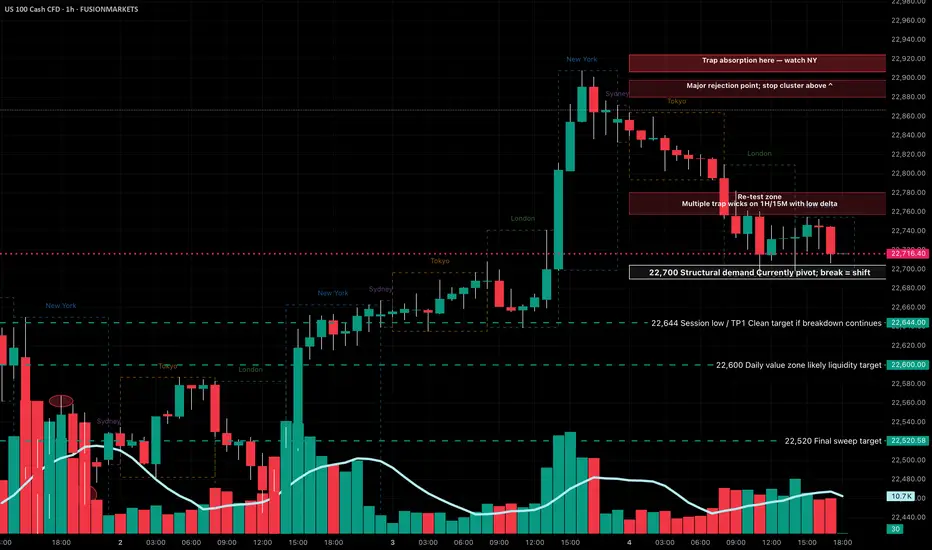
NASDAQ Key Levels July 7 2025If NY fails to reclaim 22,755–780 early in the week, expect a grind back toward 22,644 → 22,600, with 22,520 in play only if volume confirms. Reclaiming and holding above 22,800+ would invalidate this bearish setup.
Watch for trap volume, delta reversals, and volume imbalances at all key zones before entering.
22,880 – 🔻 Weekly wick top
➤ Major rejection zone with a stop cluster sitting above.
22,800–820 – Possible NY trap zone
➤ Trap absorption detected here on footprint — watch New York for rejection or breakout.
22,755–22,780 – Retest zone
➤ Multiple trap wicks with low delta on 1H/15M. Likely to bait breakout traders before fading.
22,700 – Structural demand / pivot point
➤ A clean break + hold below = bearish market shift.
22,644 – ✅ Session low / Take Profit 1
➤ If 22,700 breaks, this is the first clean downside target.
22,600 – Daily value zone
➤ High-probability liquidity target if selling extends below 22,644.
22,520 – Final sweep target
➤ Only likely if New York session sells off hard mid-to-late week.
NASDAQ Key Levels July 7 2025If NY fails to reclaim 22,755–780 early in the week, expect a grind back toward 22,644 → 22,600, with 22,520 in play only if volume confirms. Reclaiming and holding above 22,800+ would invalidate this bearish setup.
Watch for trap volume, delta reversals, and volume imbalances at all key zones before entering.
22,880 – 🔻 Weekly wick top
➤ Major rejection zone with a stop cluster sitting above.
22,800–820 – 🧱 Possible NY trap zone
➤ Trap absorption detected here on footprint — watch New York for rejection or breakout.
22,755–22,780 – 🔁 Retest zone
➤ Multiple trap wicks with low delta on 1H/15M. Likely to bait breakout traders before fading.
22,700 – ⚠️ Structural demand / pivot point
➤ A clean break + hold below = bearish market shift.
22,644 – ✅ Session low / Take Profit 1
➤ If 22,700 breaks, this is the first clean downside target.
22,600 – 🎯 Daily value zone
➤ High-probability liquidity target if selling extends below 22,644.
22,520 – 🧨 Final sweep target
➤ Only likely if New York session sells off hard mid-to-late week.
USNAS10 Faces Key Test at 22,615 Ahead of NFP VolatilityUSNAS100 – Key Levels Ahead of Major News
Today’s economic data releases (NFP, Unemployment Rate, etc.) are expected to drive volatility in the market. Traders should watch key levels closely.
Technical Outlook (USNAS10):
• Price is attempting to test 22,615.
• If it holds above 22,615, the bullish momentum is likely to continue.
• However, if price stabilizes below 22,615 on the 1H chart, further downside toward 22,420 is expected before a potential bullish reversal begins.
A breakout above 22,740 could trigger further upside toward 23,000
Key Levels:
• Resistance: 23,000 / 23,100
• Support: 22,420 / 22,280

NAS100 UPDATE - Potential Targets Dear Friends in Trading,
How I see it,
Key Support / Pivot @ 22665.00
If key support holds, bullish rally can potentially remain intact
A strong breach below 22605.00, can potentially force
price back to original demand.
I sincerely hope my point of view offers a valued insight.
Thank you for taking the time to study my analysis.
