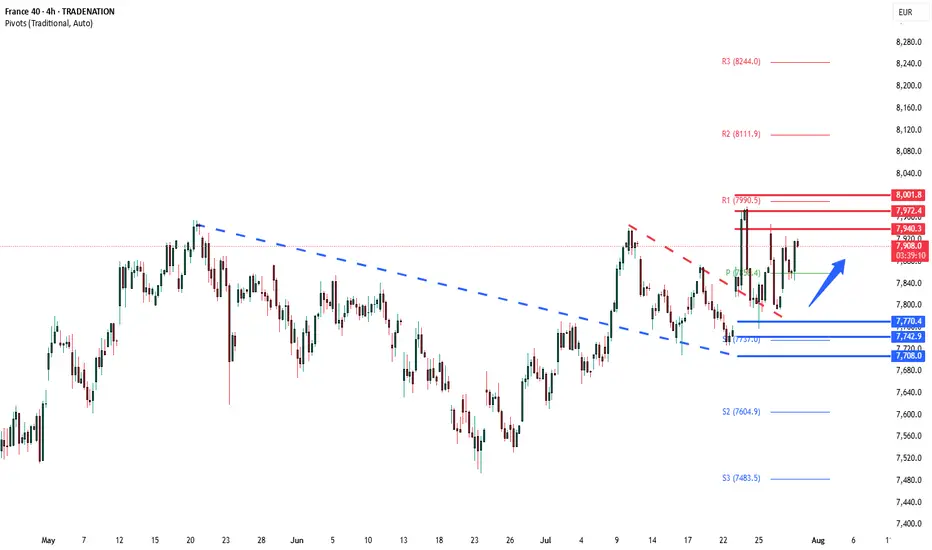
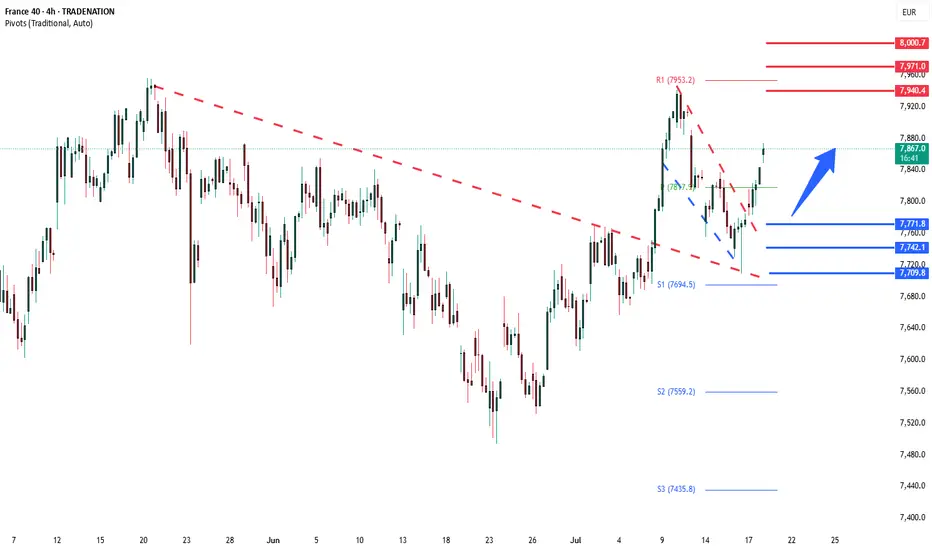
CAC40 Bullish breakout retestThe CAC 40 index continues to display a bullish bias, underpinned by a well-established rising trend. Recent intraday price action indicates a breakout from consolidation, suggesting renewed upward momentum.
Key Technical Levels:
Support:
7770 – This level marks the prior consolidation zone and now serves as critical support.
7740 – Secondary support, guarding against deeper downside.
7700 – Key psychological and technical level; a breach would suggest trend weakness.
Resistance:
7940 – Immediate upside target from the breakout pattern.
7970 – Minor resistance within an extended bullish leg.
8000 – Major psychological resistance and potential profit-taking zone.
Trading Scenarios:
Bullish Scenario:
A corrective pullback toward the 7770 level, followed by a bullish reversal, would confirm support and potentially set the stage for an advance toward 7940, with scope to extend to 7970 and 8000 in the medium term.
Bearish Scenario:
A daily close below 7770 would invalidate the bullish breakout and suggest a short-term trend reversal. This would open the door to a retracement toward 7740, with extended downside risk to 7700.
Conclusion:
The CAC 40 remains technically bullish as long as price holds above the 7770 support level. Traders should watch for confirmation of support on pullbacks to position for a continuation higher. A decisive break below 7770, however, would shift sentiment to neutral-to-bearish, triggering a deeper correction.
This communication is for informational purposes only and should not be viewed as any form of recommendation as to a particular course of action or as investment advice. It is not intended as an offer or solicitation for the purchase or sale of any financial instrument or as an official confirmation of any transaction. Opinions, estimates and assumptions expressed herein are made as of the date of this communication and are subject to change without notice. This communication has been prepared based upon information, including market prices, data and other information, believed to be reliable; however, Trade Nation does not warrant its completeness or accuracy. All market prices and market data contained in or attached to this communication are indicative and subject to change without notice.
FRA40 trade ideas
"FRA40/CAC40 HEIST! Bullish Loot Before Bear Trap – Act Fast!"💰 FRA40/CAC40 "FRANCE40" INDEX HEIST – THIEF TRADING STYLE MASTER PLAN 🏴☠️🚀
🔥 Steal the Market Like a Pro – Bullish Loot & Escape Before the Trap! 🔥
🤑 GREETINGS, FELLOW MONEY MAKERS & MARKET ROBBERS!
🌟 Hi! Hola! Ola! Bonjour! Hallo! Marhaba! 🌟
This is your VIP invite to the ultimate FRA40/CAC40 heist! Based on the 🔥Thief Trading Style🔥, we’re locking in a bullish raid before the bears set their trap. Time to swipe the loot & escape like a pro!
📜 THE HEIST BLUEPRINT – TECHNICAL & FUNDAMENTAL RAID PLAN
🎯 ENTRY POINT: "THE VAULT IS OPEN!"
📈 Long Entry: The market’s handing out free cash—swipe bullish positions at any price!
🔄 Pro Thief Move: Use buy limit orders within 15-30 min timeframe for pullback entries.
🎲 DCA/Layering Strategy: Deploy multiple limit orders to maximize loot & minimize risk.
🛑 STOP LOSS – SAFETY NET FOR THIEVES
SL at Nearest Swing Low (4H TF): 7650.00 (Adjust based on your risk, lot size & entry layers).
⚠️ Warning: Bears are lurking—don’t get caught in their trap!
🏆 TAKE PROFIT – ESCAPE BEFORE THE POLICE ARRIVE!
🎯 Primary Target: 8060.00 (or exit early if the market turns sketchy).
🚨 Danger Zone: Yellow MA Zone (Overbought, Reversal Risk, Bear Trap!)
📡 FUNDAMENTAL BACKUP – WHY THIS HEIST WILL WORK
💰 France40 is riding bullish momentum due to:
Strong Macro Data (Eurozone recovery signals)
Institutional Buying (COT Report Insights)
Geopolitical Calm (For Now… Stay Alert!)
Index-Specific Strength (Tech & Luxury Stocks Leading)
🔗 For full analysis (Fundamentals, COT, Intermarket Trends, Sentiment Score):
👉 Check the Liinkk 🔗! 👈
🚨 TRADING ALERT – NEWS & POSITION MANAGEMENT
📰 High-Impact News = Market Chaos! Protect Your Loot:
❌ Avoid new trades during major news drops.
🔐 Use Trailing Stops to lock profits & dodge sudden reversals.
💥 BOOST THE HEIST – SUPPORT THE MISSION!
🚀 Hit the "Boost" button to strengthen our robbery squad!
💰 More boosts = More profitable raids!
🎉 Let’s dominate the market daily with the Thief Trading Style!
🔐 DISCLAIMER (LEGAL SAFETY NET)
This is NOT financial advice—just a strategic raid plan. Trade at your own risk. Markets change fast; adapt or get caught!
🤑 Stay tuned for the next heist… The vaults won’t rob themselves! 🐱👤💨

CAC breakout retest support at 7770The CAC 40 index continues to display a bullish bias, underpinned by a well-established rising trend. Recent intraday price action indicates a breakout from consolidation, suggesting renewed upward momentum.
Key Technical Levels:
Support:
7770 – This level marks the prior consolidation zone and now serves as critical support.
7740 – Secondary support, guarding against deeper downside.
7700 – Key psychological and technical level; a breach would suggest trend weakness.
Resistance:
7940 – Immediate upside target from the breakout pattern.
7970 – Minor resistance within an extended bullish leg.
8000 – Major psychological resistance and potential profit-taking zone.
Trading Scenarios:
Bullish Scenario:
A corrective pullback toward the 7770 level, followed by a bullish reversal, would confirm support and potentially set the stage for an advance toward 7940, with scope to extend to 7970 and 8000 in the medium term.
Bearish Scenario:
A daily close below 7770 would invalidate the bullish breakout and suggest a short-term trend reversal. This would open the door to a retracement toward 7740, with extended downside risk to 7700.
Conclusion:
The CAC 40 remains technically bullish as long as price holds above the 7770 support level. Traders should watch for confirmation of support on pullbacks to position for a continuation higher. A decisive break below 7770, however, would shift sentiment to neutral-to-bearish, triggering a deeper correction.
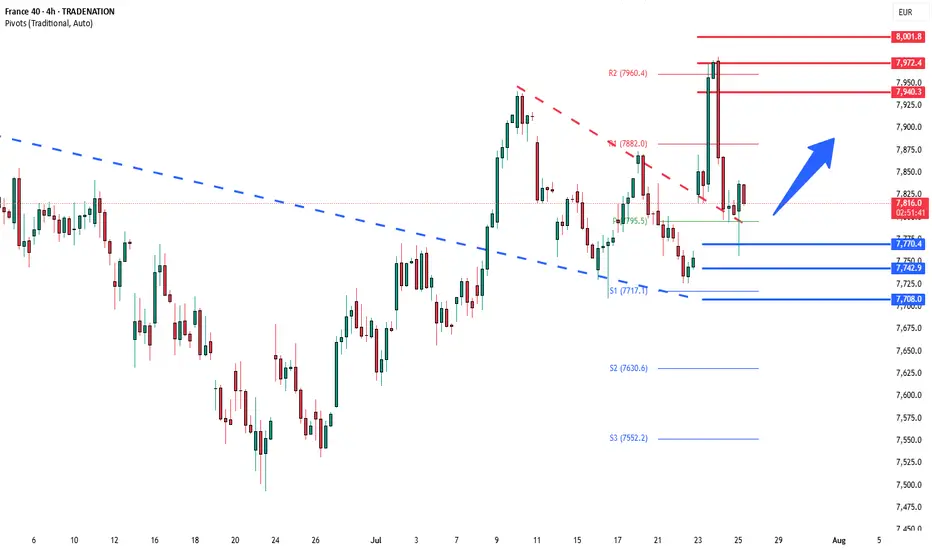
CAC40 Bullish consolidation breakout The CAC40 price action sentiment appears Bullish, supported by the current rising trend. The recent intraday price action appears to be a consolidation breakout.
The key trading level is at the 7770 level, the previous consolidation price range. A corrective pullback from current levels and a bullish bounce back from the 7770 level could target the upside resistance at 7940, followed by the 7970 and 8000 levels over the longer timeframe.
Alternatively, a confirmed loss of the 7770 support and a daily close below that level would negate the bullish outlook, opening the way for a further retracement and a retest of the 7740 support level, followed by the 7700 levels.
This communication is for informational purposes only and should not be viewed as any form of recommendation as to a particular course of action or as investment advice. It is not intended as an offer or solicitation for the purchase or sale of any financial instrument or as an official confirmation of any transaction. Opinions, estimates and assumptions expressed herein are made as of the date of this communication and are subject to change without notice. This communication has been prepared based upon information, including market prices, data and other information, believed to be reliable; however, Trade Nation does not warrant its completeness or accuracy. All market prices and market data contained in or attached to this communication are indicative and subject to change without notice.
CAC40 Bullish breakout retest support at 7770The CAC40 price action sentiment appears Bullish, supported by the current rising trend. The recent intraday price action appears to be a consolidation breakout.
The key trading level is at the 7770 level, the previous consolidation price range. A corrective pullback from current levels and a bullish bounce back from the 7770 level could target the upside resistance at 7940, followed by the 7970 and 8000 levels over the longer timeframe.
Alternatively, a confirmed loss of the 7770 support and a daily close below that level would negate the bullish outlook, opening the way for a further retracement and a retest of the 7740 support level, followed by the 7700 levels.
This communication is for informational purposes only and should not be viewed as any form of recommendation as to a particular course of action or as investment advice. It is not intended as an offer or solicitation for the purchase or sale of any financial instrument or as an official confirmation of any transaction. Opinions, estimates and assumptions expressed herein are made as of the date of this communication and are subject to change without notice. This communication has been prepared based upon information, including market prices, data and other information, believed to be reliable; however, Trade Nation does not warrant its completeness or accuracy. All market prices and market data contained in or attached to this communication are indicative and subject to change without notice.
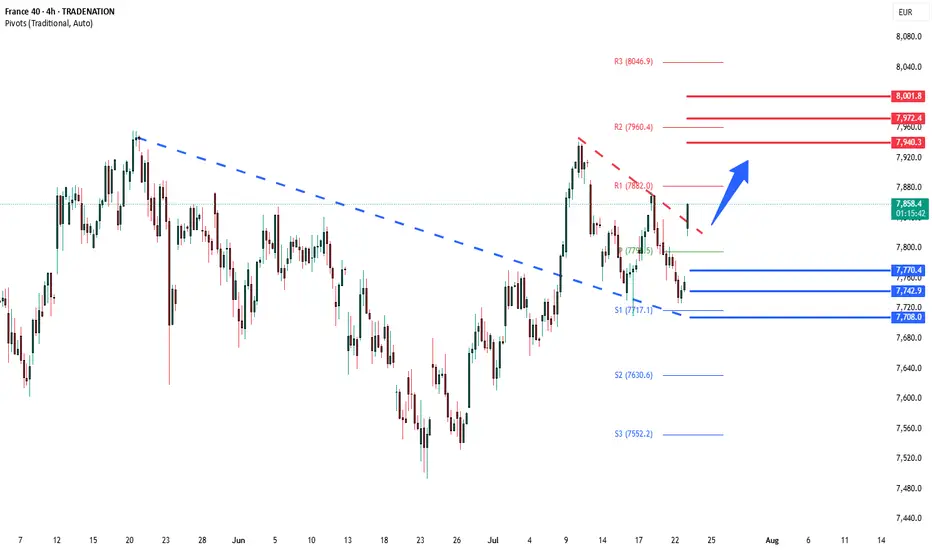
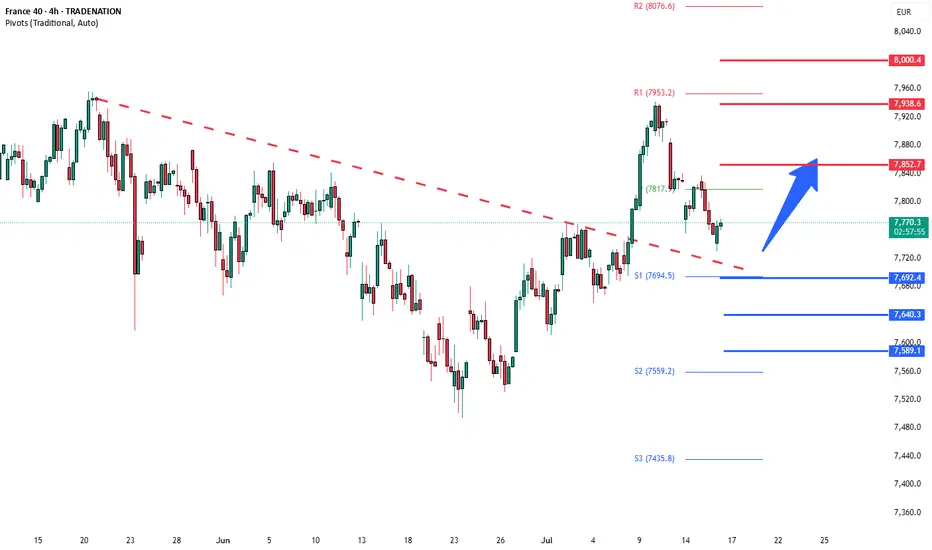
CAC40 Bullish breakout retest support at 7690The CAC40 remains in a bullish trend, with recent price action showing signs of a corrective pullback within the broader uptrend.
Support Zone: 7960 – a key level from previous consolidation. Price is currently testing or approaching this level.
A bullish rebound from 7690 would confirm ongoing upside momentum, with potential targets at:
7850 – initial resistance
7940 – psychological and structural level
8000 – extended resistance on the longer-term chart
Bearish Scenario:
A confirmed break and daily close below 7690 would weaken the bullish outlook and suggest deeper downside risk toward:
7640 – minor support
7590 – stronger support and potential demand zone
Outlook:
Bullish bias remains intact while the CAC40 holds above 7690. A sustained break below this level could shift momentum to the downside in the short term.
This communication is for informational purposes only and should not be viewed as any form of recommendation as to a particular course of action or as investment advice. It is not intended as an offer or solicitation for the purchase or sale of any financial instrument or as an official confirmation of any transaction. Opinions, estimates and assumptions expressed herein are made as of the date of this communication and are subject to change without notice. This communication has been prepared based upon information, including market prices, data and other information, believed to be reliable; however, Trade Nation does not warrant its completeness or accuracy. All market prices and market data contained in or attached to this communication are indicative and subject to change without notice.
FRANCE 40 Heist in Progress | Bullish Reversal Zone Spotted.💼 CAC40 Market Heist: Thief Trading Blueprint for Smart Traders (Swing/Day Trade Edition) 💼
🌍 Bonjour, Hola, Hallo, Marhaba, Ola, Hello! 🌍
Welcome to all Market Hustlers, Silent Snipers, and Profit Seekers! 🤑💸🎯
We're back with a precision-built Thief Trading Plan — this time targeting the FRANCE40 / CAC40 Index, using a combination of street-smart technicals and sharp macro insights.
🧠 Game Plan: The “Market Heist” Strategy
This strategy revolves around a Long Entry setup aiming for the high-risk Red Zone. Price is pushing into potential overbought territory, with signs of consolidation and trend exhaustion. That’s exactly where reversal opportunities and big moves live — right before the herd wakes up. 🐂💰
🔓 Entry Plan – "The Vault’s Open"
📍 Enter on bullish setups – recommended through:
Recent 15/30 min support levels or
Swing low/high based buy limit zones
💡 Pro Tip: Set alerts at those critical swing levels so you’re always one step ahead.
🛑 Stop Loss – "Stay Out of Jail"
🎯 Suggested SL: Near the recent 3H swing low (~7600 zone)
🧩 Adjust SL based on:
Risk tolerance
Lot size
Multiple entries
Trading strategy preference
🎯 Take Profit – "The Great Escape"
📌 Primary TP: 7830.00
🔐 Trailing SL advised to secure profits during the climb
🚨 If market shifts or trap signs emerge, exit early and protect the bag.
⚔️ Scalpers vs Swingers – Choose Your Crew
Scalpers: Only ride the long waves. Use momentum & micro breakouts.
Swing Traders: Follow the blueprint. This is your time to rob the trend cleanly. 🕶️📈
🧩 Market Insight & Fundamentals
This bullish momentum is backed by key drivers:
Economic releases
Institutional positioning (COT Reports)
Sentiment & intermarket flows
Geopolitical & macro factors
📌 Always update your narrative. Markets shift fast. Stay informed. Stay sharp.
⚠️ Important Trading Notice – News Risk & Management
🚫 Avoid fresh entries during high-impact news events
🔄 Use trailing SLs to lock gains
🧠 Be aware of volatility traps
❤️ Support the Strategy – Hit Boost & Join the Crew
If this strategy made sense to you, smash that Boost Button.
You're not just supporting a post — you're fueling a Thief Trader movement where smart, fearless traders take what’s theirs from the market. 🚀💰
🎉 Keep winning, stay alert, and I’ll see you in the next heist! 🧠💸🐱👤

France 40 is priming up for strong upside to 8,673France is definitely setting itself for upside to come.
We have positive data from the love country including:
📈 Oversold Conditions
The CAC 40 was heavily sold off — now it’s ripe for a bounce.
🏦 ECB Rate Cuts
Lower interest rates fuel investor appetite for European equities.
💼 Strong Corporate Earnings
French companies are reporting resilient profits despite volatility.
💰 Foreign Investment Flowing In
Global funds see value and are buying the dip in France.
Technicals also look great including:
W Formation is forming but hasn't broken the neckline just yet.
Price>20 and 200MA
Target 8,673
Disclosure: I am part of Trade Nation's Influencer program and receive a monthly fee for using their TradingView charts in my analysis.

CAC40 Bullish breakout supported at 7560Key Support and Resistance Levels
Resistance Level 1: 7850
Resistance Level 2: 7930
Resistance Level 3: 7995
Support Level 1: 7560
Support Level 2: 7490
Support Level 3: 7410
This communication is for informational purposes only and should not be viewed as any form of recommendation as to a particular course of action or as investment advice. It is not intended as an offer or solicitation for the purchase or sale of any financial instrument or as an official confirmation of any transaction. Opinions, estimates and assumptions expressed herein are made as of the date of this communication and are subject to change without notice. This communication has been prepared based upon information, including market prices, data and other information, believed to be reliable; however, Trade Nation does not warrant its completeness or accuracy. All market prices and market data contained in or attached to this communication are indicative and subject to change without notice.

France 40: A short/medium term buyHello,
The France 40 Index is currently forming a compelling bullish setup, characterized by a contracting triangle pattern—typically a continuation structure that signals the potential for further upward movement. Price action is consolidating within this triangle, indicating that a breakout could be imminent.
Supporting this view, the moving average is aligning with the current price zone, suggesting an attractive entry point for medium-term traders looking to position early for the next leg up.
Additionally, the MACD (Moving Average Convergence Divergence) is showing early signs of a bullish zero-line crossover, reinforcing the bullish sentiment and adding further conviction to the setup.
We identify 8,206 as a potential upside target for investors willing to capitalize on this opportunity. For prudent risk management, a stop-loss order placed just below the lower boundary of the triangle pattern is advisable.
Disclosure: I am part of Trade Nation's Influencer program and receive a monthly fee for using their TradingView charts in my analysis.

CAC40 corrective pullback support at 7480Key Support and Resistance Levels
Resistance Level 1: 7850
Resistance Level 2: 7930
Resistance Level 3: 7995
Support Level 1: 7480
Support Level 2: 7400
Support Level 3: 7330
This communication is for informational purposes only and should not be viewed as any form of recommendation as to a particular course of action or as investment advice. It is not intended as an offer or solicitation for the purchase or sale of any financial instrument or as an official confirmation of any transaction. Opinions, estimates and assumptions expressed herein are made as of the date of this communication and are subject to change without notice. This communication has been prepared based upon information, including market prices, data and other information, believed to be reliable; however, Trade Nation does not warrant its completeness or accuracy. All market prices and market data contained in or attached to this communication are indicative and subject to change without notice.

CAC40 protracted coiling consolidation support at 7630Key Support and Resistance Levels
Resistance Level 1: 7788
Resistance Level 2: 7920
Resistance Level 3: 7995
Support Level 1: 7630
Support Level 2: 7578
Support Level 3: 7500
This communication is for informational purposes only and should not be viewed as any form of recommendation as to a particular course of action or as investment advice. It is not intended as an offer or solicitation for the purchase or sale of any financial instrument or as an official confirmation of any transaction. Opinions, estimates and assumptions expressed herein are made as of the date of this communication and are subject to change without notice. This communication has been prepared based upon information, including market prices, data and other information, believed to be reliable; however, Trade Nation does not warrant its completeness or accuracy. All market prices and market data contained in or attached to this communication are indicative and subject to change without notice.

FRA40 IS BULLISHAs it stands now, we will not be making a mistake, if we invest in long position on FOREXCOM:FRA40 ,

CAC40 INTRADAY coiling pattern- energy buildupKey Support and Resistance Levels
Resistance Level 1: 7890
Resistance Level 2: 7970
Resistance Level 3: 8070
Support Level 1: 7700
Support Level 2: 7620
Support Level 3: 7510
This communication is for informational purposes only and should not be viewed as any form of recommendation as to a particular course of action or as investment advice. It is not intended as an offer or solicitation for the purchase or sale of any financial instrument or as an official confirmation of any transaction. Opinions, estimates and assumptions expressed herein are made as of the date of this communication and are subject to change without notice. This communication has been prepared based upon information, including market prices, data and other information, believed to be reliable; however, Trade Nation does not warrant its completeness or accuracy. All market prices and market data contained in or attached to this communication are indicative and subject to change without notice.

Slow upside for France - But is it inevitable to 8,645?France and Germany and I guess Europe in general is just slow.
Lifestyle is slow and steady, not major developments.
Life continues with a somewhat socialistic form of living.
And so moves the indices in Europe the same way.
We established a Cup and Handle, and was waiting for a breakout above the brim level. Which We kind of got.
But now we are in consolidation mode, and we can expect some sideways before it breaks out of what looks like a Descending Triangle.
The funny thing is Descending Triangles generally have breakouts to the downside, but we are anticipating it breaks up.
Biased maybe. Intuition - Yes.
Cup and handle
Price>20 and 200MA
Target 8,645
Disclosure: I am part of Trade Nation's Influencer program and receive a monthly fee for using their TradingView charts in my analysis.

"FR40 TIME-BOMB TRADE: PROFIT BEFORE THE CLOCK RUNS OUT!"🔥 FRANCE 40 HEIST: STEAL THE TREND LIKE A MARKET BANDIT! 🚨💰
Locked & loaded for the FR40 (FRANCE 40) heist? This slick blueprint cracks the code to loot profits—blending killer technicals with macro intel. Ride the bullish wave, but dodge traps near the Overbought Zone. Bears lurk, so secure your bag before the reversal hits! 🐻💨
🎯 ENTRY: STRIKE LIKE A PRO THIEF
Long the breakout near 7900.0 (or) ambush pullbacks at 7620.0 or above.
Set stealth alerts to catch moves in real-time. 🕶️🔔
🛡️ STOP LOSS: ESCAPE ALIVE
Hide stops under the last 4H swing low/wick—no reckless bets!
Adjust for your risk—survivors play smart. ⚡
💸 TAKE PROFIT: VANISH WITH THE LOOT
Main Target: 8150.0 (or bail early if momentum fades).
Scalpers: Trail stops & ghost out with quick wins. 🏃♂️💨
📡 WHY THIS HEIST WORKS
FRANCE 40's on fire: Fundamentals + COT data + macro tides align.
Sentiment’s bullish, but stay sharp—links below for the full intel. 🔍🌐
⚠️ WARNING: NEWS = POLICE SIRENS
Avoid new trades during high-impact news. 📢
Lock profits with trailing stops if you’re already in. 🔐
🤝 JOIN THE TRADING MAFIA
Smash LIKE, drop a comment, & let’s dominate the US100! �
Ready for the next big move? Stay tuned. 👀
Happy hunting, chart pirates! 🏴☠️📉

Analysis of CAC 40 IndexIn our recent analysis, we predicted a price decline based on harmonic patterns, with an anticipated bottom of €7,200.
However, recent fluctuations indicate that French shareholders have yet to liquidate their holdings. This suggests a potential shift in market sentiment that could impact future trends.
We foresee that these declines may continue until reach the golden level of the Golden Crab pattern. As savvy investors, staying informed and adapting to market movements is crucial.
SEYED.

CAC40 France is looking parfait for upside to 8,645Another Index ready to rumble is way up again.
The sideways chop has broken above and we are seeing more signs of strength for the bulls on major international markets.
UNless this is all a dead cat bounce, the analyses right now are poised for upside.
Here are some fundamentals.
📉 Trade Tensions Ease
U.S.-China tariff cuts lift global markets — CAC 40 joins the rally.
🏗️ Europe Builds Big
New EU infrastructure spending boosts industrial stocks in France.
🏦 Banks & Industry Up
French banks and factories post strong earnings and drive gains.
💶 ECB May Cut Rates
Rate cut hopes make stocks like CAC 40 more attractive.
🛍️ Luxury Demand Surges
LVMH and other French luxury brands benefit from global spending.
ANd let's tackle the technicals.
Cup and handle
Price>20 and 200MA
Target 8,645
Disclosure: I am part of Trade Nation's Influencer program and receive a monthly fee for using their TradingView charts in my analysis.

CAC40 INTRADAY rising wedge capped at 7705The CAC40 index shows a bearish sentiment, with the overall trend remaining negative. Recent price action suggests a short-term oversold rally that could face resistance near the 7705 level — a key previous consolidation area.
Key Resistance: 7705
A failure to break above this level could lead to renewed selling pressure.
Bearish Scenario:
If the price is rejected at 7705, downside targets include:
7500 (initial support)
7456
7330 (longer-term target)
Bullish Scenario:
A confirmed breakout and daily close above 7705 would invalidate the bearish outlook and open the door for a rally toward:
7830
7900
Conclusion:
The outlook remains bearish unless CAC40 can break and hold above 7705. Watch this level closely for directional clues.
This communication is for informational purposes only and should not be viewed as any form of recommendation as to a particular course of action or as investment advice. It is not intended as an offer or solicitation for the purchase or sale of any financial instrument or as an official confirmation of any transaction. Opinions, estimates and assumptions expressed herein are made as of the date of this communication and are subject to change without notice. This communication has been prepared based upon information, including market prices, data and other information, believed to be reliable; however, Trade Nation does not warrant its completeness or accuracy. All market prices and market data contained in or attached to this communication are indicative and subject to change without notice.

CAC40 IMPORTANT resistance retest at 7454
The CAC40 continues to exhibit bearish sentiment, aligning with the prevailing downward trend. Recent price action suggests that the index experienced an oversold rally, which was subsequently rejected near a key resistance zone — the previous intraday consolidation level around 7454.
This area now serves as a critical pivot point. A failure to break above 7454, followed by renewed selling pressure, would likely confirm a bearish reversal, with downside targets at:
7170 – Near-term support
7000 – Medium-term support
6828 – Long-term support level
However, if price breaks and closes firmly above 7454 on a daily basis, the bearish scenario would be invalidated. In that case, the DAX40 could extend gains toward:
7592 – Immediate resistance
7754 – Major upside target
Conclusion
The bias remains bearish below 7454, with rallies into that level offering potential short opportunities. A daily close above 7454, however, would shift sentiment and open the door for bullish continuation toward higher resistance levels.
This communication is for informational purposes only and should not be viewed as any form of recommendation as to a particular course of action or as investment advice. It is not intended as an offer or solicitation for the purchase or sale of any financial instrument or as an official confirmation of any transaction. Opinions, estimates and assumptions expressed herein are made as of the date of this communication and are subject to change without notice. This communication has been prepared based upon information, including market prices, data and other information, believed to be reliable; however, Trade Nation does not warrant its completeness or accuracy. All market prices and market data contained in or attached to this communication are indicative and subject to change without notice.

CAC40 INTRADAY oversold boumce back capped at 7186The CAC 40 continues to exhibit bearish sentiment, in line with the prevailing downtrend. Recent price action has confirmed a break below a key consolidation support zone, reinforcing the downside bias.
Key Technical Levels:
Resistance Zone: 7000 (short-term), 7186 (major resistance / former consolidation zone)
Support Levels: 6760 (initial target), 6630 (intermediate), 6474 (longer-term support)
Bearish Scenario:
The loss of support at 7186 has shifted the bias to the downside. A potential oversold rebound may occur, but unless price reclaims and holds above 7000 on a daily closing basis, rallies are likely to face selling pressure. A bearish rejection at 7186, if retested, would confirm the continuation of the downtrend toward the stated support levels.
Bullish Alternative:
A confirmed breakout above 7000, with a daily close above this level, would challenge the current bearish outlook. In such a case, the index may regain bullish momentum, opening the path for a retest of 7186, followed by 7290.
Conclusion:
The technical outlook for the CAC 40 remains bearish unless a decisive breakout above 7000 occurs. Traders should watch for rejection patterns near 7000–7186 for potential short entries, while a daily close above 7000 would be a key trigger for a trend reversal and a shift in sentiment.
This communication is for informational purposes only and should not be viewed as any form of recommendation as to a particular course of action or as investment advice. It is not intended as an offer or solicitation for the purchase or sale of any financial instrument or as an official confirmation of any transaction. Opinions, estimates and assumptions expressed herein are made as of the date of this communication and are subject to change without notice. This communication has been prepared based upon information, including market prices, data and other information, believed to be reliable; however, Trade Nation does not warrant its completeness or accuracy. All market prices and market data contained in or attached to this communication are indicative and subject to change without notice.

Analysis of CAC 40 Index The CAC 40, France's leading stock market index, has recently captured the attention of investors as it nears a significant milestone of 8160 points.
According to technical analysis, the index might be on the verge of a notable downturn, potentially influenced by the bearish "Crab" harmonic pattern.
This formation hints at the possibility of a sharp retracement following a peak, driven by shifts in market sentiment and economic factors.
As the CAC 40 approaches this crucial level, investors should exercise caution, as a potential break below this threshold could trigger heightened volatility and put further downward pressure on stock prices.

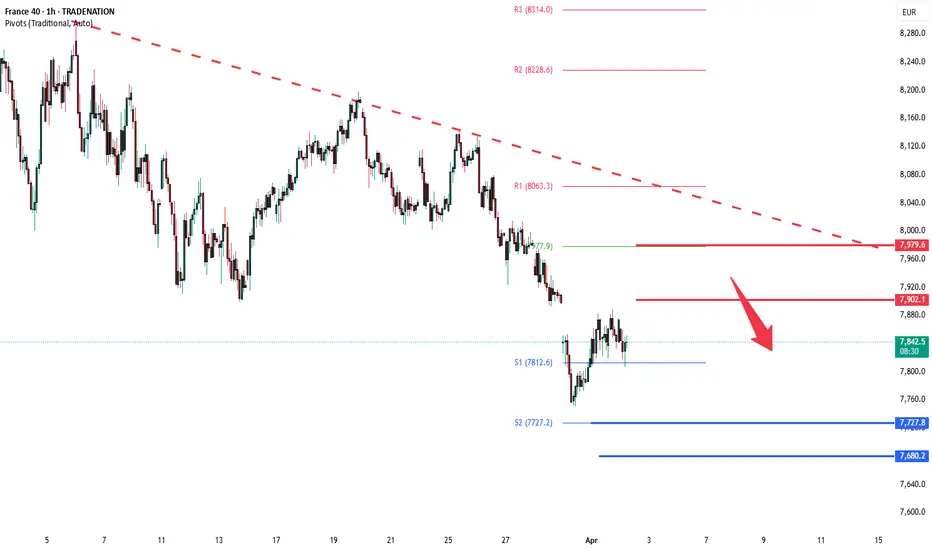
CAC40 capped by resistance at 7,900The CAC40 index is exhibiting bearish sentiment, aligning with the prevailing downtrend. The recent price action suggests an oversold bounce, which may be temporary before the downtrend resumes.
Key Level: 7,900
This level represents the previous intraday consolidation zone and serves as a crucial resistance point.
Bearish Scenario: If the index faces rejection at 7,900, it could resume its decline, targeting 7,728, followed by 7,680 and 7,552 as long-term support levels.
Bullish Scenario: A confirmed breakout above 7,900 with a daily close beyond this level would invalidate the bearish outlook, potentially leading to rallies toward 7,980 and 8,060.
Conclusion:
The CAC40 remains in a bearish trend unless a strong breakout above 7,900 confirms a shift in momentum. Traders should watch for rejection or confirmation at this key level to determine the next move.
This communication is for informational purposes only and should not be viewed as any form of recommendation as to a particular course of action or as investment advice. It is not intended as an offer or solicitation for the purchase or sale of any financial instrument or as an official confirmation of any transaction. Opinions, estimates and assumptions expressed herein are made as of the date of this communication and are subject to change without notice. This communication has been prepared based upon information, including market prices, data and other information, believed to be reliable; however, Trade Nation does not warrant its completeness or accuracy. All market prices and market data contained in or attached to this communication are indicative and subject to change without notice.