US DOLLAR: Sell opportunity following channel breakPrice on DXY recently broke above a sharp descending channel, but the move lacked presence. There was no real follow-through and certainly no conviction behind the candles. It felt hesitant, as this is a great indication for us to use.
Instead of accelerating upward, price now hovers just above the

Dollar I Daily CLS I Model 1 I Time for pullbackHey, Market Warriors, here is another outlook on this instrument
If you’ve been following me, you already know every setup you see is built around a CLS Footprint, a Key Level, Liquidity and a specific execution model.
If you haven't followed me yet, start now.
My trading system is completely

DXY Bullish Reversal Setup Toward 98.20 Target Entry Point
Marked at: ~97.200
The price has already reacted multiple times around this level, suggesting it's a key support zone.
🛑 Stop Loss
Placed at: ~96.930
Just below the support zone, protecting against a breakdown below recent lows.
This implies a risk of about 27 pips from the entry.

DOLLAR INDEX (DXY): Bearish Move After BreakoutThe Dollar Index has surpassed and closed below a key daily/intraday support level.
After retesting this level, the price rebounded and breached a resistance line of a rising wedge pattern, suggesting a strong likelihood of a continued bearish trend.
It is highly probable that the price will soo

DXY: Weekly OutlookWeekly DXY Outlook
On the weekly chart, the US Dollar Index (DXY) has reached a critical zone that was last tested in February 2022.
While a rebound is not guaranteed, the fact that the DXY has declined nearly 12% over just six months—despite a resilient U.S. economy—suggests the potential for re

DXY 1D – Tipping Point: News or Price Action?Hey Guys,
The DXY index is currently moving within a downtrend. This trend is unlikely to reverse unless it breaks above the 98.950 level.
Sure, key fundamental data could shift the trend, but without those news catalysts, a reversal at this point doesn’t seem realistic.
Don’t forget—98.950 is a c

There is a possible down push on xauusdIf the trend can break through the resistance there's possibly a little long down push on xauusd

I would be looking for reversal patterns on the ES and the Russe7 1 25 I made a few mistakes naming some of the markets but if you can deal with that then I explain what my concerns are regarding some of the patterns. most of the trades that I posted as trading opportunities have moved higher and did not require large stops. I spent time on a certain pat

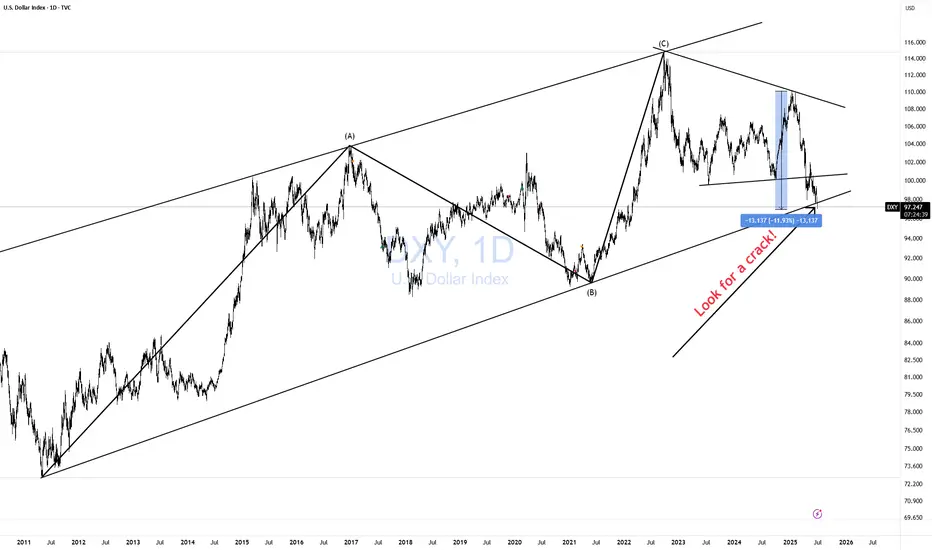
DXY CRACK! BAD JUJU!After Trump unilaterally imposed Tariffs (Taxes) on its citizens to buy imported goods from the rest of the world, promising 90 deals in 90 days, "in two weeks", the demand for the dollar payment system has collapsed by -12% reducing purchasing power for all $ holders'.
Imports of goods mean export

See all ideas
Displays a symbol's price movements over previous years to identify recurring trends.
Frequently Asked Questions
USDX Dollar Basket Index DXU5 Exp 03/09/2025 23:59 reached its highest quote on Jan 13, 2025 — 109.991 USD. See more data on the USDX Dollar Basket Index DXU5 Exp 03/09/2025 23:59 chart.
The lowest ever quote of USDX Dollar Basket Index DXU5 Exp 03/09/2025 23:59 is 96.584 USD. It was reached on Jun 26, 2025. See more data on the USDX Dollar Basket Index DXU5 Exp 03/09/2025 23:59 chart.
USDX Dollar Basket Index DXU5 Exp 03/09/2025 23:59 is just a number that lets you track performance of the instruments comprising the index, so you can't invest in it directly. But you can buy USDX Dollar Basket Index DXU5 Exp 03/09/2025 23:59 futures or funds or invest in its components.