Could that be it for DXY ?DXY could drop at the best scenario to 98 - 100 or a deeper correction giving the market some oxygen
USDX trade ideas

The tariff legal zig-zagWith different US courts firing "shots" at each other over the legality of tariffs, the market is taking a bit of a pause from accelerating further. Let's dig in!
DJ:DJI
TVC:SPX
TVC:NDQ
TVC:DXY
Let us know what you think in the comments below.
Thank you.
77.3% of retail investor accounts lose money when trading CFDs with this provider. You should consider whether you understand how CFDs work and whether you can afford to take the high risk of losing your money. Past performance is not necessarily indicative of future results. The value of investments may fall as well as rise and the investor may not get back the amount initially invested. This content is not intended for nor applicable to residents of the UK. Cryptocurrency CFDs and spread bets are restricted in the UK for all retail clients.

dxY drops to 95OH MY GOD! bad news for gold.
dxY drops to 95
I think gold easily breaks the 3500 high and goes to 3700

Dollar Still making its way to our targetDollar is still drifting lower. We do have NFP Tomorrow so want to watch what it does. I think we might spike up to some LTF stops then droft lower to the target again. This is just experience speaking I have no idea what will happen. No one does!!!

4 June 2025 DXY Bearish BIAS4 JUNE 2025
DXY Expected to be bearish, Price has retrace to 50% - 75% with a momentum bearish signal Expected DXY to Continue Bearish.
DXY Bearish :
SELL USDXXX atau Buy XXXUSD & GOLD

U.S. Dollar Index When you check the weekly timeframe, you will see massive wick to from the past week.
Because of this we can tell that this week will be extremly bullish.
---USD PAIRS LONG
USD--- PAIRS SHORT
Trade the plan & Plan the trade

Dollar BearishAs per yesterdays video. We are still below the block highlited before the fact.
We still hunting the Target on Dollar as shown in the chart.

U.S. Dollar Index . 1MLong-term DXY (Dollar Index) Analysis
Greetings to all valued followers,
This is a long-term analysis and macroeconomic outlook based on Smart Money Concepts (SMC), carefully charted with key reactive zones highlighted. Within this analysis, significant support levels, imbalance zones, and liquidity pools are outlined, which can guide your market decisions as the price reaches these areas.
Key Zones Based on the Monthly Timeframe
Support (Monthly): 97.441
This level is considered the primary support. It’s expected that, should the price reach this zone, a reaction or corrective rally might unfold.
Support (Monthly): 94.629
This is the secondary support, which acts as the next target if the previous support is broken. Typically, these supports indicate potential reversal points or short-term retracements.
Imbalance Zone (Unfinished Business):
Range: 91.782 – 91.436
This zone represents an Imbalance, signalling a strong disequilibrium in the market. The market will likely revisit this area to restore balance (rebalancing).
Significance: It acts as a Liquidity Magnet — if the Federal Reserve fails to provide sufficient liquidity and the support line is broken, the price will tend to continue downward into this zone to gather the required liquidity for economic rebuilding and confirmation of a bearish trend.
Liquidity Pool:
Liquidity (M): 89.209
This is a liquidity pool where, should the bearish momentum persist, the price is expected to test or reach this level. A significant volume of buy and sell orders are accumulated here, making it a crucial target for further downside.
Charting Summary and Outlook:
The monthly supports at 97.441 and 94.629 are key areas to watch, with market reactions to be evaluated via Order Blocks and Break of Structure (BOS) signals.
The imbalance zone between 91.782 and 91.436 may trigger a retracement within the ongoing downtrend — traders should look for confirmation signals in price action.
If the market fails to gather enough liquidity in these zones, the next downside target would be around 89.209, indicating a continuation of the bearish trend.

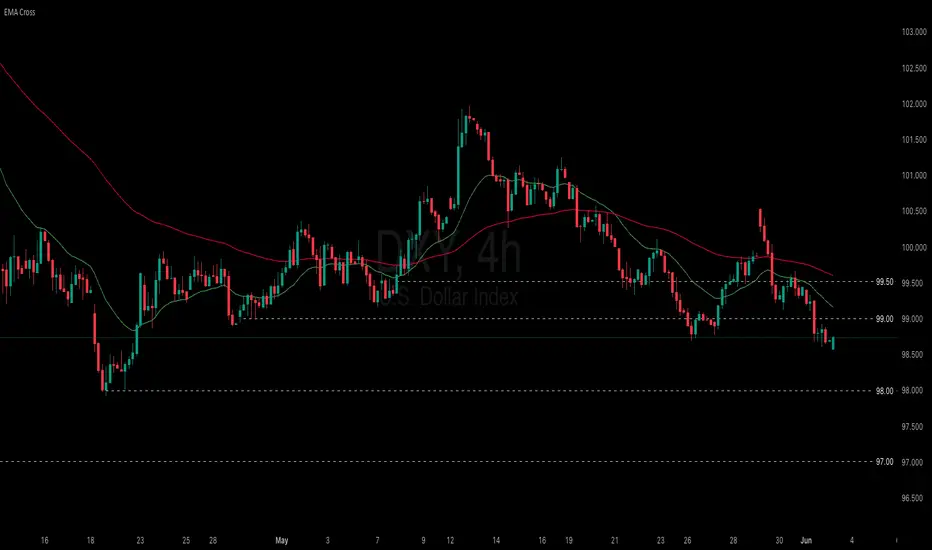
Persistent concerns about the US economy are weighing on the DXY
US-China tensions deepened as President Trump criticized China’s rare earth exports and threatened broader tech restrictions and visa cancellations for Chinese students. He also vowed to double tariffs on foreign steel to 50% to strengthen the US steel industry. April headline PCE inflation eased to 2.1% (prev. 2.3%, cons. 2.2%), partly soothing tariff-related inflation concerns.
DXY broke below the 99.00 threshold and dropped to a 6-week low. EMA21 is widening its gap with EMA78, suggesting a potential extension of the bearish structure. If DXY breaks below the support at 98.00, the index may decline further to 97.00. Conversely, if DXY reclaims the resistance at 99.00 and breaches above EMA21, the index could advance to 99.50.
Bretton Woods 2.0?Examining the long-term trend of TVC:DXY since the 1980s, we might be facing a staggering 40% reduction in valuation, potentially landing us around 60. If the US were to devalue the dollar this drastically, could it effectively erase the national debt? 🤔 Is Trump bold enough to consider such a move?
We know the FED is going to cut eventually, the question is when and by how much? Initial claims came in higher than estimated, with cracks beginning to show in the labor market, how much longer can JPow hold out?

DXY: Local Bearish Bias! Short!
My dear friends,
Today we will analyse DXY together☺️
The market is at an inflection zone and price has now reached an area around 98.335 where previous reversals or breakouts have occurred.And a price reaction that we are seeing on multiple timeframes here could signal the next move down so we can enter on confirmation, and target the next key level of 98.090..Stop-loss is recommended beyond the inflection zone.
❤️Sending you lots of Love and Hugs❤️

Highly likely the DXY goes down.Trading the DXY increase in 2022 was my best trade of that year. Specifically on the USD/CAD pair not the whole index. Options worked great for this.
I had call options on USX not the company. It's Options on the US Dollar (USX) on the TMX exchange in Montreal Canada. To gain exposure to a rising dollar, or to hedge existing positions, call options on USX can be an effective tool. If DXY is going down like 2020-2021 it's great for stocks and equities. A falling dollar is also beneficial from the perspective of US national debt, as it makes interest payments cheaper in relative terms. Also many people outside the US have USD debts so example they make CAD but their debts are in USD. Well now their company is worth more as debt went down and revenue up. Otherwise known as currency risk. Very important for companies dealing in multiple currencies regardless of the type of business they do.
The US has incentive for a weaker dollar as the interest payments on their debt are now around $1 Trillion a year.
This yellow line represents a significant long-term resistance level. As long as the price fails to break and hold above this zone, the path of least resistance remains to the downside.
The MACD is currently moving down, supporting a bearish bias. However, there are two key bullish signals I am watching that would challenge this view:
The Bullish Crossover: This occurs if the blue MACD line crosses above the orange signal line.
On the daily timeframe, a simple crossover can sometimes be a temporary fake-out (like
the "flip-flopping" seen around April 3rd-9th). While it's a warning, it's not always a
definitive trend changer on its own.
The Bullish Divergence: This is the more powerful signal. If the price has set a new low since
April 2025 but the MACD has formed a higher low, it creates a bullish divergence. A
confirmation of this pattern could signal the end of the long-term downtrend and mark a
serious change in market conditions.
A bullish crossover happening at the same time as a confirmed bullish divergence would be a very strong combination, making a short position on the DXY extremely risky.
**Disclaimer:**
*The information provided in this post is for educational and informational purposes only. It does not constitute financial advice, investment recommendations, or a solicitation to buy or sell any financial instruments. All investments involve risk, and the past performance of a security, market, or trading strategy does not guarantee future results. I am not a financial advisor. Please conduct your own thorough research and consult with a qualified financial professional before making any investment decisions. You are solely responsible for any investment decisions you make.*

BULLISH REVERSALThe frame of a possible trade
On the Daily time frame, going back to what we can identify as the parent move
price gapped to the upside, filled with wicks and candles, price moves to the upside
leaving short-term lows(STL)
Price retraced and took liquidity at STL
On the Daily time frame, price expands violating a Daily Sell-side Imbalance Buy-side Inefficiency
05/29/25 Price gapped up, taking out liquidity at a STH
If this price action implies bullishness, then price will have to take/deliver some form of sellside
This is happening ahead of the Core PCE Price Index Data release on Friday 30/05/25

DXY,USDCHF & USDCAD Daily Trade SetupsIn this update, we review the recent price action in the Dollar Index, the Swissy, and the Loonie and identify the next high-probability trading locations and price objectives to target. To review today's video analysis, click here!

BTCUSD BEARSBITCOIN is clear bearish as price just broke the most sensitive zone to the downside. Our target should be the first sensitive bullish zone as we are in HTF.

USXUSD HOTW SetUSXUSD Expansion lower expected.
Previous Monthly Low, April Lows, are our target.
Let's see.

US DOLLAR FORECAST (update)Update of stalking bullish behavior in the USD instrument.
Intermarket confluence has aligned instruments such as Gold & US Stocks are soft to Bearish, I focus on XAUUSD and US30 outside of Oil to gauge validity of idea.
Thus said focus is on the 5 min chart, we seek rejections framed from 30 min area of interests.
Trigger should be after 5m Bullish playbook, manipulation is a sign of a healthy "auction".

US DOLLAR INDEX Correlation Between Dollar Index (DXY), 10-Year Bond Yields, Bond Prices, and Interest Rates
1. Bond Prices vs. Yields
Inverse Relationship: Bond prices and yields move in opposite directions.
When bond prices rise, yields fall (e.g., demand for safe-haven assets drives prices up).
When bond prices fall, yields rise (e.g., selling pressure due to inflation fears).
Example: A 1% Fed rate hike can cause bond prices to drop, pushing 10-year yields up by ~1.3% .
2. 10-Year Bond Yields vs. Dollar Index (DXY)
Positive Correlation: Typically, higher yields attract foreign capital into USD assets, strengthening the dollar.
A 1% rise in 10-year yields historically correlates with a 1–2% DXY appreciation .
Risk-Off Scenarios: Investors may flock to both Treasuries (pushing yields down) and USD (DXY↑), weakening the usual correlation .
Policy Divergence: If the Fed delays rate cuts amid global easing, yields and DXY may diverge temporarily .
3. Interest Rates vs. Dollar Index (DXY)
Direct Relationship: Higher US interest rates strengthen the dollar by attracting yield-seeking capital.
A 25-basis-point Fed rate hike can boost DXY by 1–2% .
Example: In 2018, Fed rate hikes to 2.5% drove DXY gains of ~8% .
Inverse Impact on Bonds: Rate hikes depress bond prices (yields rise), reinforcing the DXY-yield link .
4. Interest Rates vs. Bond Yields
Policy-Driven: Fed rate changes directly influence short-term yields, while long-term yields (e.g., 10-year) reflect growth/inflation expectations.
The 10-year yield often leads Fed policy shifts. For example, yields fell 150 basis points ahead of 2019 rate cuts .
The 2-year Treasury yield is particularly sensitive to Fed expectations, serving as a "policy barometer" .
Summary Table of Relationships
Factor Relationship with DXY Relationship with 10-Year Yields
Bond Prices ↑ DXY ↓ (safe-haven flows weaken USD) Yields ↓ (inverse bond price-yield link)
10-Year Yields ↑ DXY ↑ (capital inflows) —
Interest Rates ↑ DXY ↑ (yield appeal) Yields ↑ (policy tightening)
Risk-Off Sentiment DXY ↑ (safe-haven demand) Yields ↓ (bond buying)
Key Exceptions and Contexts
Term Premium Dynamics:
Recent 10-year yield spikes (e.g., to 4.54%) are driven by market psychology (90% due to deficits/inflation fears vs. 10% fundamentals) .
Economic Growth Differentials:
Stronger US GDP growth (vs. peers) supports both yields and DXY, while weak growth decouples them .
Geopolitical Risks:
Trade tensions (e.g., US-China tariffs) can strengthen DXY as a safe haven, even if yields dip .
Conclusion
The Dollar Index (DXY) and 10-year bond yields generally share a positive correlation, reinforced by interest rate policies and capital flows. However, this relationship can weaken during risk-off environments or when fiscal/monetary policies diverge. Bond prices and yields remain inversely tied, while Fed rate decisions directly impact both yields and the dollar. Traders should monitor growth data, inflation trends, and central bank signals to navigate these interconnected dynamics.
#DOLLAR #USD #GOLD #SILVER #COPPER

DOLLARTHE dollar index resumes buying on demand floor on multiple confirmation and one more break of supplyroof will push for rally above 100$

dxy had a good base formation ,looks to spike up dxy looks good at 99.77 looks like spike up , on a other not metals can be affected.

DXY aka usd 28 May 2025Price has formed a 5 waves up from the bottom, expecting correction lower before another attempt higher.


Beware, the US dollar is at a technical crossroads 1) The US Dollar remains the weakest major Forex currency in 2025
The US dollar has had a difficult year on the foreign exchange market (Forex), recording a decline of over 9% against the world's major currencies, despite the Federal Reserve's continuing rigid monetary policy. Technically speaking, the DXY index has reached several theoretical bearish targets, notably according to Elliot analysis, but has not yet touched the key objective of the A=C movement. This dynamic is also evident in the strong chartist compression in weekly data, placing the USD at a potential breakout point. The EUR/USD and USD/JPY pairs are also in long-term hinge configurations, and institutional positions remain broadly bearish on the US dollar against a basket of major currencies.
Two interesting charts on the current situation are presented below: the first shows Japanese candlesticks in monthly data, and the second is a theoretical reminder of how Elliott waves work.
As long as the US dollar against a basket of major currencies (DXY) remains below the indicated pivot line, the trend remains bearish, with a target of 95/96 points. Conversely, a rebound above the hinged pivot line would put an end to the US dollar's annual correction, with the starting point for a technical recovery.
2) A weakening dollar despite an inflexible Fed: how to explain this paradox?
The apparent paradox of a falling US dollar while US interest rates remain high and the Fed does not expect to cut rates before September/October, goes beyond simple rate differentials. At a time when the ECB has already embarked on a policy of monetary easing, the rate differential with the Fed should normally support the USD. However, other factors are taking over: the markets' growing mistrust of US assets, fuelled by trade tensions and uncertainty over Trump's fiscal policy, is weakening demand for dollars. Added to this is a major liquidity factor: the recent increase in the money supply (M2) in the United States and the decline in reverse repo operations, which reflect an implicit easing of financial conditions. This easing is encouraging persistent downward pressure on the greenback, despite a Fed that remains intransigent on rates.
The next release of US PCE inflation, scheduled for Friday May 30, could play an important catalytic role: a higher-than-expected figure would strengthen the case for an even firmer Fed, which could offer the USD a temporary technical rebound. Conversely, confirmation of disinflation would fuel bets on future easing and accentuate selling pressure. In short, the US dollar is not only at a technical crossroads, but also a fundamental one, suspended between forthcoming monetary action and deeper signals from the global liquidity market.
DISCLAIMER:
This content is intended for individuals who are familiar with financial markets and instruments and is for information purposes only. The presented idea (including market commentary, market data and observations) is not a work product of any research department of Swissquote or its affiliates. This material is intended to highlight market action and does not constitute investment, legal or tax advice. If you are a retail investor or lack experience in trading complex financial products, it is advisable to seek professional advice from licensed advisor before making any financial decisions.
This content is not intended to manipulate the market or encourage any specific financial behavior.
Swissquote makes no representation or warranty as to the quality, completeness, accuracy, comprehensiveness or non-infringement of such content. The views expressed are those of the consultant and are provided for educational purposes only. Any information provided relating to a product or market should not be construed as recommending an investment strategy or transaction. Past performance is not a guarantee of future results.
Swissquote and its employees and representatives shall in no event be held liable for any damages or losses arising directly or indirectly from decisions made on the basis of this content.
The use of any third-party brands or trademarks is for information only and does not imply endorsement by Swissquote, or that the trademark owner has authorised Swissquote to promote its products or services.
Swissquote is the marketing brand for the activities of Swissquote Bank Ltd (Switzerland) regulated by FINMA, Swissquote Capital Markets Limited regulated by CySEC (Cyprus), Swissquote Bank Europe SA (Luxembourg) regulated by the CSSF, Swissquote Ltd (UK) regulated by the FCA, Swissquote Financial Services (Malta) Ltd regulated by the Malta Financial Services Authority, Swissquote MEA Ltd. (UAE) regulated by the Dubai Financial Services Authority, Swissquote Pte Ltd (Singapore) regulated by the Monetary Authority of Singapore, Swissquote Asia Limited (Hong Kong) licensed by the Hong Kong Securities and Futures Commission (SFC) and Swissquote South Africa (Pty) Ltd supervised by the FSCA.
Products and services of Swissquote are only intended for those permitted to receive them under local law.
All investments carry a degree of risk. The risk of loss in trading or holding financial instruments can be substantial. The value of financial instruments, including but not limited to stocks, bonds, cryptocurrencies, and other assets, can fluctuate both upwards and downwards. There is a significant risk of financial loss when buying, selling, holding, staking, or investing in these instruments. SQBE makes no recommendations regarding any specific investment, transaction, or the use of any particular investment strategy.
CFDs are complex instruments and come with a high risk of losing money rapidly due to leverage. The vast majority of retail client accounts suffer capital losses when trading in CFDs. You should consider whether you understand how CFDs work and whether you can afford to take the high risk of losing your money.
Digital Assets are unregulated in most countries and consumer protection rules may not apply. As highly volatile speculative investments, Digital Assets are not suitable for investors without a high-risk tolerance. Make sure you understand each Digital Asset before you trade.
Cryptocurrencies are not considered legal tender in some jurisdictions and are subject to regulatory uncertainties.
The use of Internet-based systems can involve high risks, including, but not limited to, fraud, cyber-attacks, network and communication failures, as well as identity theft and phishing attacks related to crypto-assets.
