The Great DeflationDeductive Thoughts: Global interest rates continue their decline towards zero. Soon, most major economies will be under the pressure of deflation. On the one hand, negative interest rates have shown to be not viable to boost inflation, risking a debt crisis of the private sector piling up "free" loans. On the other hand, quantitative easing also shown to be not viable, risking a debt crisis of the public sector piling up private debt.
Inductive Thoughts: Global economic policies will need to change this coming year, or a reason to inflate must be put forth. Major economies cannot sustain previous growth rates as they begin to fill in to all the available room. Two possible solutions: War; or Mars. Wars are infamous for their spur of inflationary periods. However, a global effort to colonize Mars would prove just as potent to spur growth.
The Trade: Sell USD and buy GOLD into the devaluation of the dollar. Sell stocks, sell bonds (interest rates are not returning to previous levels, so bonds no longer safe haven).
DGS10 trade ideas

$tlt $spy Rising yield curve could be black swan (see comments)So, the FED wants inflation anchored at 2%. They're gonna cut to negative rates if they have to. LMAO! No wage inflation, ecnomony deteriorating and you want to add wage inflation and price pressure to stocks already stagnant natural earnings growth? Maybe they can continue to manufacture earnings, but I wouldn't bet on that. This isn't the 90's or 95' in particular. No where close to similar situation. Good luck!

$spy $tlt it's not the inversion you worry aboutIt is when the flattening/inversion bottoms and begins to steepen that gets the market

inversionArmstrong notes that during economic panics short term rates exceed long term then collapse to near zero, flight to dollar, then rates rise hard 'n fast due to money supply

UPD: 2/10's yield curve entering support area $TLT, $IEFCorrelation with gold positive, volatility at cycle lows $GLD, GC_F

Copper / Gold ratio pointing to lower Treasury yieldsCopper / Gold ratio pointing to lower 10 year Treasury yields around 2.40%. US yields seem to high on many measures but improving CESI and too much safety bid lately can push yields even higher before the real downturn begins.

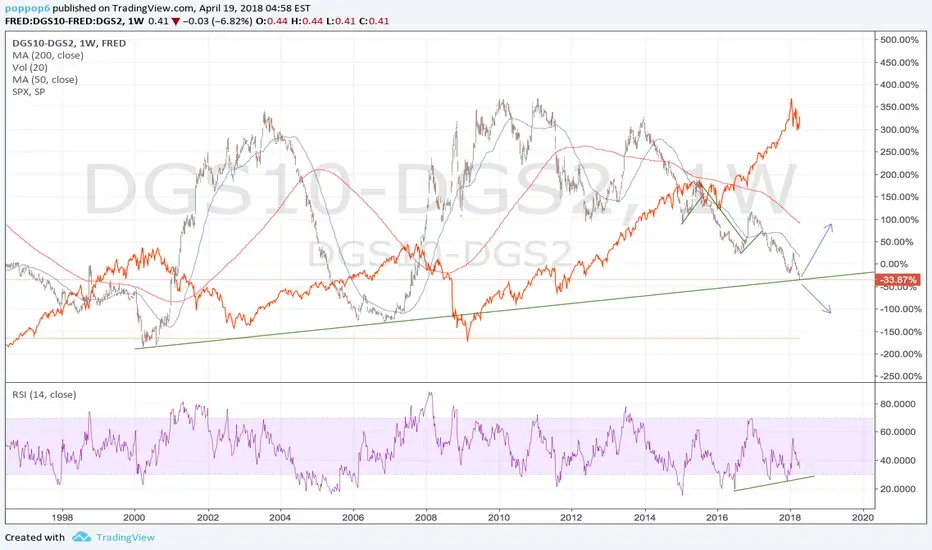
Yield spreadI charted this a while ago. The 10-2 yr yield spread has a trajectory to invert first half of 2019. Originally, I was thinking the second half of 2019, but present circumstances have expedited this path.


10-2 Spread w/ Recessions - DJI Overlay10-2 Spread w/ Recessions. DJI overlay to show market performance. Horizontal lines at 0 and 0.5.

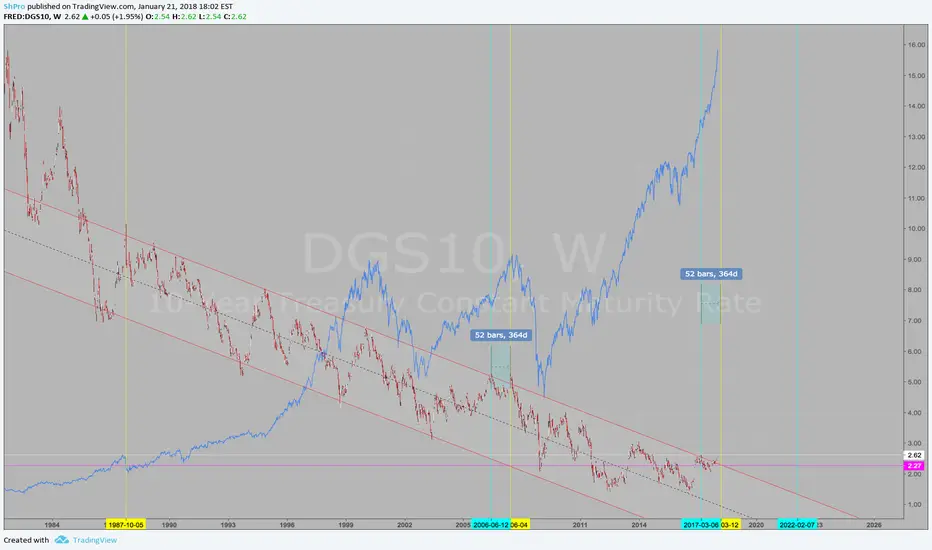
Long US TSY (yield) - Target Zone 5% ~5.30%Long US TSY (yield) - Target Zone 5% ~5.30%
Broke the Long term down trend.
Monetary expansion (ZIRP + QE).
Inflation will come, but before, we will need to see a Commodities boom, as the last movement of growth economic cycle.


US Interest rates headed higherFor the first time since the 1980s, the US 10 year treasury yield is showing a sustained breakout above the red line.. the 120 SMA in this chart.
Since US interest rates were trending lower over 30 years, this is monumental.
With the risk of a tariff war growing, and oil prices projected to rise to $90 in the coming months, we can see how this is all coming together.
The world is awash in debt. When this debt comes due, will businesses be able to re-finance? This is going to put the big squeeze on global growth.
The transition to higher rates is happening and will be painful. If rates rise quickly... highly likely.... that pain could prove fatal for many businesses.
Winter is coming...


What does spread do here?Does the 10-2's continue on to negative area, which is usually predictive of a market being close to top or is it at a bottom right here? Financial stocks not reacting well to stellar earnings. Some negative divergence on RSI. Is the tolerance level due to massive debt now higher? What do you think @allstarcharts I'm torn. History has shown that this becomes a problem for markets when the spread goes negative. Still has 42 bps before that happens. Is it different this time?


UPD:2/10 yield curve entering resistance after turned on supportIf WW valid, should reach the upper supply zone $TNX, $TLT, $GLD

10 year note yield channel break and its effect on indiceswww.tradingview.com
Using a parallel channel tool, I drew a precise line using gaps as starting points and end points, middle channel also using gaps as reference.
I always compare my charts to DXY, USDWTI, DGS10-DTB3 (yield curve) and market indices, particularly SPX.
Comparing the 10 year note yield to SPX painted a clear picture. Still, I've yet to test this. If not mistaken, we will see a correction starting this week. Even what is today's bull market since 2009 will be topping, if correct of course.
Also to note are double tops and the subsequent drop and what happens to SPX. I did no mark this, but you can try and find these double tops.
If you look even closer, other details an be observed, particularly during flash crashes such as in May 6th 2010 and June 23rd 2016 (Brexit).
There are other flash crash dates that can be found, but I'll leave that to you.


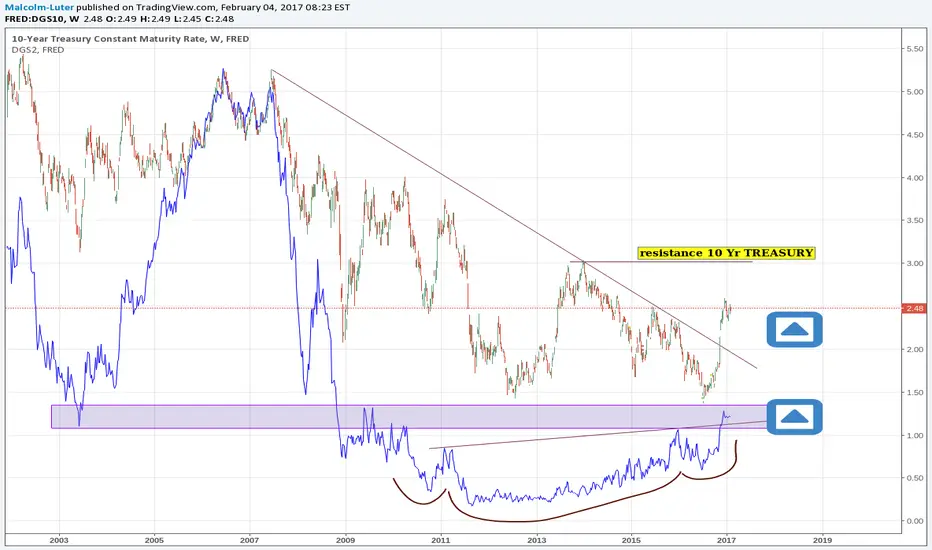
10 Year & 2 Year Treasury GOING UPThe signal on 2Yr is clear = Bottom Reverse (H&S in confirmation)
10Year approaching resistance for building 2 bottom UP