Yield Curve normalization and Stocks reaction $spy $tltAs long as the curve remains inverted stocks have a tail wind. It's the normalization that will crush stocks
About 30-Year Treasury Constant Maturity Rate
Related indicators

$spy $tlt What you should fear is the yld curve revertingBack to normal. That is the signal that the FED has eff'ed things up and a major earnings recession is coming. Think 200X15 on s&p500

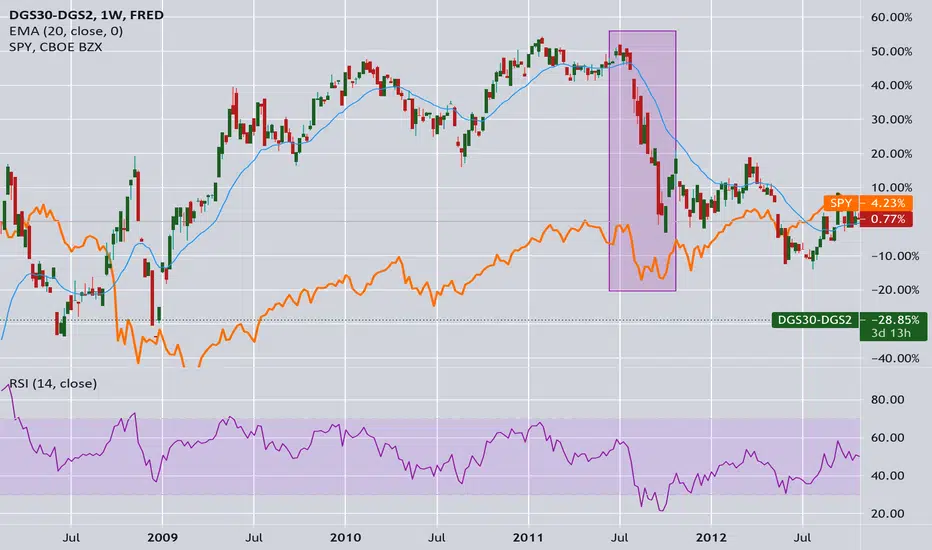
$spy $tlt The yield curve problemThe inversion of the yield curve becomes problematic when it starts reversing. This is starting to happen at a higher and higher levels where true inversion isn't necessary for economic destruction. What level will it stop at this time? each of the past 4 have been at higher levels. My guess is

Bonds and the vitality of the market and overarching economy.In this chart, I find it important to (as an economist) monitor treasuries and bonds, luckily Tradingview has us covered there. The next few charts will be some economic correlations so we can better understand the economy before I get into the meat and potatoes of this system . As you can see, bond

$spy $tlt I think we are right here 2011Similar time of year, similar case of inflation creeping back in and a housing bubble to boot. Fed needs to begin draining liquidity from $mbs Likely to cause a hiccup in the market
2021-05-06 UST 30YR YIELD VS. XAU/USDInteresting to see an 85% increase in 30 yr yield since September only caused a 12% drop in gold vs. USD

$spy $tlt Yld spread update. DangerThe yield curve is steepening and moving above the danger level. As you can see back in late 1999's we had a hiccup in the spread which caused a sell off, but it corrected itself and market continued on. We had a similar hiccup this past year which caused a correction in the market and then it cont

30's - 10's spread predictor of future $spy directionWhen this spread gets close to or below 0, we should start becoming more risk
adverse in our trading. While conditions may persist for a period of time, the change
in direct of spread usually leads to a change in direction of $spy. Something to watch

30 yr - 10 yr spread vs spyDo you notice any similarities in this chart? Whenever this spread approaches zero, the market is at risk of a market shock/correction. Especially when it gets this weak of a reading in RSI.

Short Term Treasury Yields Rise = Pain to comeI feel that the bond market is the greatest indicator of the stock market's future. Who else is more concerned about their money than ultra-conservative bondholders? We see in the graph as the short-term Treasury yield rises (in red) from lack of demand and selling off. The sell-off in the short-ter

See all ideas