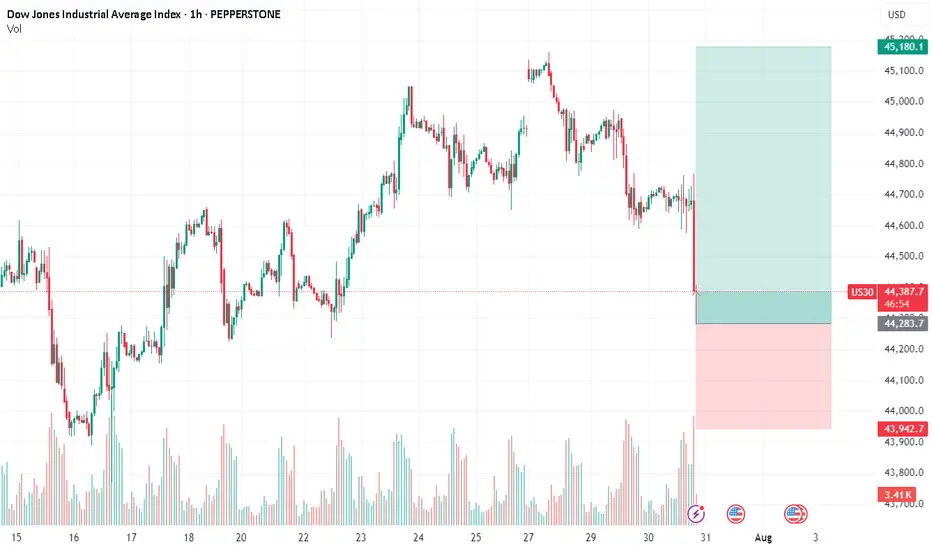
US30 Bearish Breakout!
HI,Traders !
#US30 made a bearish
Breakout of the key horizontal
Level of 44822.3which also
Seems to have been a neckline
Of the small H&S pattern so
We are locally bearish biased
And we will be expecting a
Further bearish move down !
Comment and subscribe to help us grow !
About Dow Jones Industrial Average
Related indicators

Bullish bounce off overlap support?Dow Jones (US30) is falling towards the pivot and could bounce to the 1st resistance which acts as a swing high resistance.
Pivot: 44,596.08
1st Support: 44,267.57
1st Resistance: 45,106.42
Risk Warning:
Trading Forex and CFDs carries a high level of risk to your capital and you should only trad

Us30usd sellI entered a sell trade from the LS zone. The PEZ zones were all used up. I set the last one as my TP.


US30: : Local Bullish Bias! Long!
My dear friends,
Today we will analyse US30 together☺️
The recent price action suggests a shift in mid-term momentum. A break above the current local range around 44,802.50 will confirm the new direction upwards with the target being the next key level of 44,914.32 and a reconvened placement o

US30: Absolute Price Collapse Ahead! Short!
My dear friends,
Today we will analyse US30 together☺️
The in-trend continuation seems likely as the current long-term trend appears to be strong, and price is holding below a key level of 44,459.35 So a bearish continuation seems plausible, targeting the next low. We should enter on confirmat


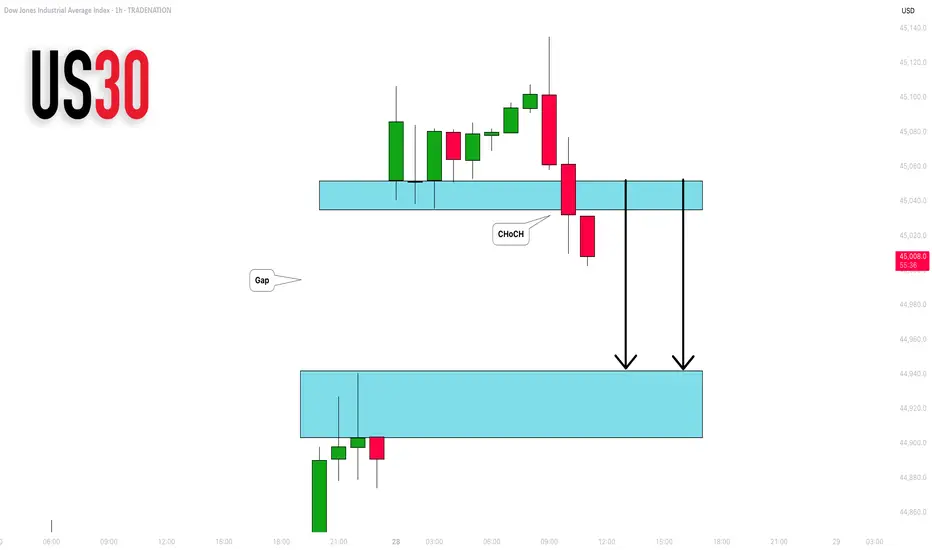
DOW JONES INDEX (US30): Another Gap For Today?
I see another gap up opening on US30 Index.
I think it will be filled today. A formation of an intraday
bearish CHoCH on an hourly time frame suggests
a highly probable bearish continuation.
Goal - 44943
❤️Please, support my work with like, thank you!❤️
I am part of Trade Nation's Influence

DOW/US30 - PATIENCE IS THE KEYTeam, i expect the DOW/ NAS will be selling off due RATE unchange
i am going LONG now at 44335-44300 ranges
STOP LOSS at 44195
Target 1 at 44500-44550
Target 2 at 44600-44630
LETS GO
By the way, if you trade AUS200 today, both target hit on SHORT.
See all ideas