Possibility of uptrend The uptrend is expected to move in the specified direction and advance to the specified targets. If the indicator does not consolidate above the current resistance level, there is a possibility of a double-digit combination pattern. Then a correction is likely.
DJIA trade ideas
Dow Jones Index Analysis (US30 / Dow Jones):🔹 The index broke below a key support zone yesterday and is now consolidating between 44,720 USD and 44,620 USD.
1️⃣ If bullish momentum leads to a break and close above 44,740 USD, the price may retest the 44,970 USD zone.
2️⃣ However, if the price breaks below 44,600 USD and holds, a decline toward 44,350 USD is likely.
⚠️ Disclaimer:
This analysis is not financial advice. It is recommended to monitor the markets and carefully analyze the data before making any investment decisions.

Do you agree with a big profit in US30?
Hello friend
Do you think the orange line will break?
What if it breaks?
Just wait and collect the money.
If you liked my analysis, please support me by liking, commenting and subscribing. Thanks friend

US30 07/29 Sell Trade I don't like sells because I consider myself an optimistic person but the red candle that I mark in red gave me all I needed to know to enter sell and get my target profit filled. So. I know there is variation in this trade but we were on a downtrend and going against the trend is only acceptable when the trend is over( meaning a reversal) . So when I see a big candle break the support of my variation I entered

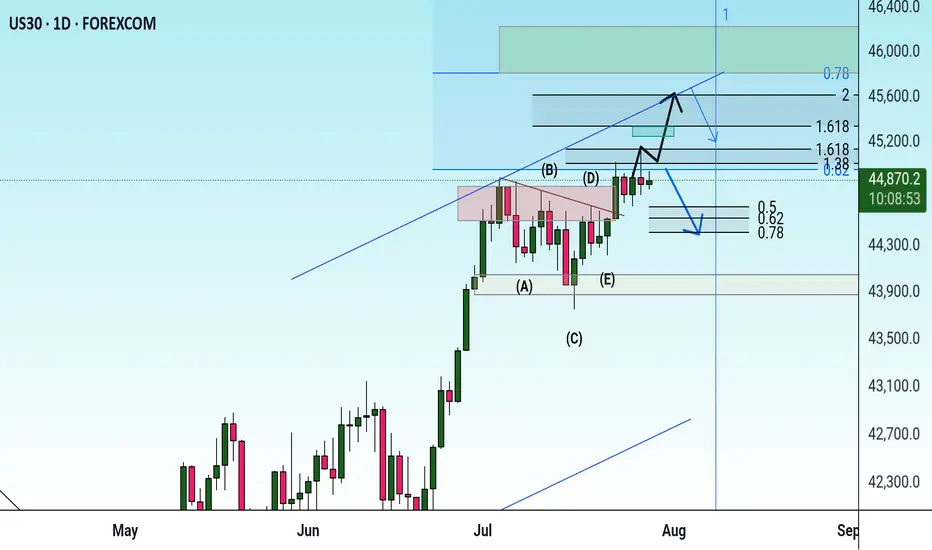
Dow Jones Wave Analysis – 29 July 2025
- Dow Jones reversed from the long-term resistance level 45000.00
- Likely fall to support level 44000.00
Dow Jones index recently reversed down from the resistance zone between the long-term resistance level 45000.00 (which has been reversing the price from the end of 2024) and the upper daily Bollinger Band.
The downward reversal from this resistance zone created the daily Japanese candlesticks reversal pattern, Bearish Engulfing.
Given the strength of the resistance level 45000.00 and the bearish divergence on the daily Stochastic, Dow Jones index can be expected to fall to the next support level 44000.00 (which reversed the price earlier in July).

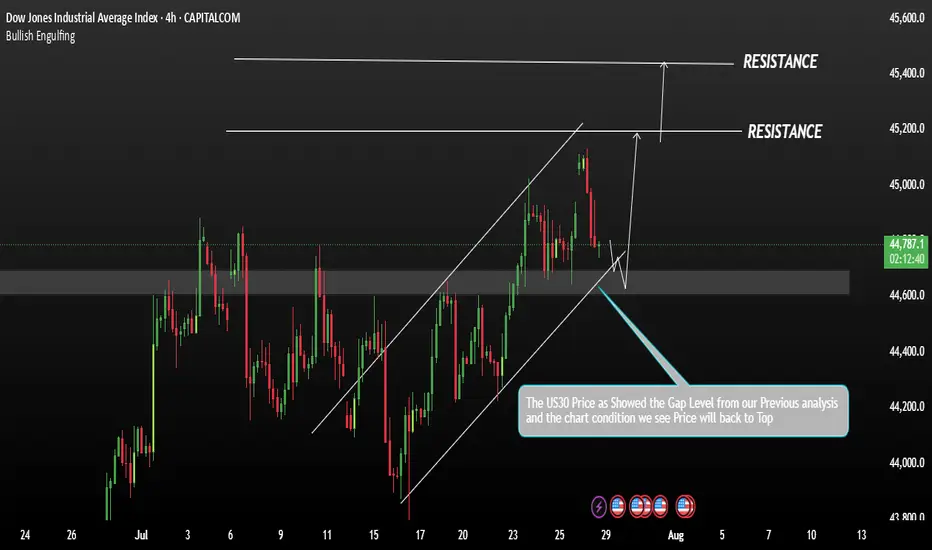
US30 Correction with in a Downtrend ChannelUS30 is currently in a consolidation phase within a broader bullish trend. From our previous analysis, the index has shown strong upward momentum. However, to confirm a potential bearish shift, the price would need to break back below key support levels, potentially leading to a deeper correction.
If the price stabilizes above 44,000 on the 4H timeframe, this would strengthen the bullish momentum. A sustained move above this level could open the path towards the next targets at 45,200 and 45,400.
You May find more details in the chart.
Ps: Support with like and comments for better analysis
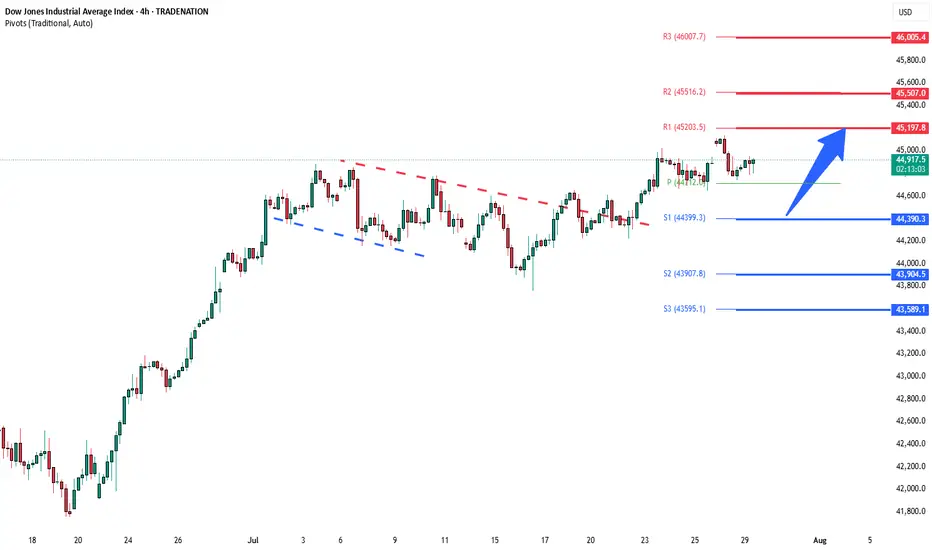
DowJones bullish breakout support at 44390Key Support and Resistance Levels
Resistance Level 1: 45197
Resistance Level 2: 45507
Resistance Level 3: 46000
Support Level 1: 44390
Support Level 2: 43900
Support Level 3: 43590
This communication is for informational purposes only and should not be viewed as any form of recommendation as to a particular course of action or as investment advice. It is not intended as an offer or solicitation for the purchase or sale of any financial instrument or as an official confirmation of any transaction. Opinions, estimates and assumptions expressed herein are made as of the date of this communication and are subject to change without notice. This communication has been prepared based upon information, including market prices, data and other information, believed to be reliable; however, Trade Nation does not warrant its completeness or accuracy. All market prices and market data contained in or attached to this communication are indicative and subject to change without notice.
OVERVIEW The price is currently undergoing a bearish correctionUS30 OVERVIEW
The price is currently undergoing a bearish correction, targeting 44910. To confirm a bearish trend continuation, the price must break below 44770, which would likely lead to a move toward 44610.
However, if the price stabilizes above 44910 on the 4H timeframe, a bullish reversal may begin. A confirmed break above 45100 would strengthen bullish momentum and open the path toward 45290.
Key Levels:
• Pivot Line: 45045
• Support: 44910 – 44770 – 44610
• Resistance: 45100 – 45290

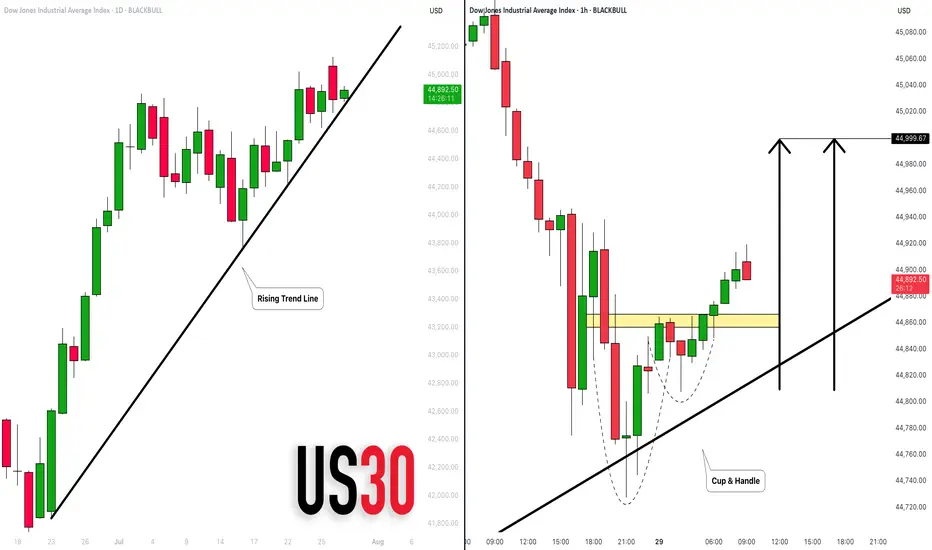
DOW JONES INDEX (US30): Bullish Move From Trend Line
There is a high probability that US30 will continue rising today,
following a test of a solid rising trend line on a daily.
As a confirmation, I see a cup & handle on that after its test
on an hourly time frame.
Goal - 45000
❤️Please, support my work with like, thank you!❤️
US30 Forecast: Target Locked, Buy Zones in Sight!Good morning friends ☀️
I've prepared a fresh analysis for US30 (Dow Jones).
My current target is 45,470. Even if the price dips to 45,050 or 44,800, I fully expect it to reach that 45,470 mark.
These levels represent strong buying zones and powerful retest regions—don’t forget that.
Every like from you is my biggest source of motivation to keep posting these insights. 💬📊
Big thanks to everyone supporting with a thumbs-up.

US30There's a clear bullish flag pattern and strong price action on the 1 minute timeframe. I expect at least a small rally long with a high R:R based of the 1 minute timeframe 1:3R+

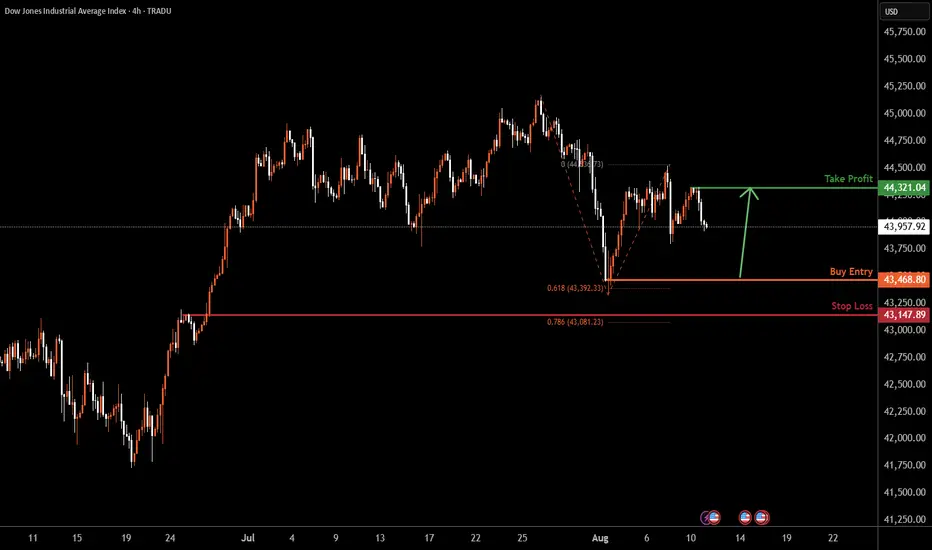
US30 H4 | Falling towards pullback supportBased on the H4 chart analysis, we could see the price fall to the buy entr at 43,468.80, which is a swing low support that is slightly above the 61.8% Fibonacci projection.
Stop loss is at 43,147.89, whihc is a pullback support that is slighlty above the 78.6% Fibonacci retracement.
Take profit is at 44,321.04, which is a swing high ressitance.
High Risk Investment Warning
Trading Forex/CFDs on margin carries a high level of risk and may not be suitable for all investors. Leverage can work against you.
Stratos Markets Limited (tradu.com ):
CFDs are complex instruments and come with a high risk of losing money rapidly due to leverage. 65% of retail investor accounts lose money when trading CFDs with this provider. You should consider whether you understand how CFDs work and whether you can afford to take the high risk of losing your money.
Stratos Europe Ltd (tradu.com ):
CFDs are complex instruments and come with a high risk of losing money rapidly due to leverage. 66% of retail investor accounts lose money when trading CFDs with this provider. You should consider whether you understand how CFDs work and whether you can afford to take the high risk of losing your money.
Stratos Global LLC (tradu.com ):
Losses can exceed deposits.
Please be advised that the information presented on TradingView is provided to Tradu (‘Company’, ‘we’) by a third-party provider (‘TFA Global Pte Ltd’). Please be reminded that you are solely responsible for the trading decisions on your account. There is a very high degree of risk involved in trading. Any information and/or content is intended entirely for research, educational and informational purposes only and does not constitute investment or consultation advice or investment strategy. The information is not tailored to the investment needs of any specific person and therefore does not involve a consideration of any of the investment objectives, financial situation or needs of any viewer that may receive it. Kindly also note that past performance is not a reliable indicator of future results. Actual results may differ materially from those anticipated in forward-looking or past performance statements. We assume no liability as to the accuracy or completeness of any of the information and/or content provided herein and the Company cannot be held responsible for any omission, mistake nor for any loss or damage including without limitation to any loss of profit which may arise from reliance on any information supplied by TFA Global Pte Ltd.
The speaker(s) is neither an employee, agent nor representative of Tradu and is therefore acting independently. The opinions given are their own, constitute general market commentary, and do not constitute the opinion or advice of Tradu or any form of personal or investment advice. Tradu neither endorses nor guarantees offerings of third-party speakers, nor is Tradu responsible for the content, veracity or opinions of third-party speakers, presenters or participants.

Bearish reversal?US30 is risng towards the resistance level which is. a pullback resistance and could reverse from this lev to our take profit.
Entry: 44,455.14
Why we like it:
There is a spullbsck resistance.
Stop loss: 44,768.60
Why we like it:
There is an overlap resistance.
Take profit: 43,469.99
Why we like it:
There is a pullback support that is slightly above the 61.8% Fibonacci projection.
Enjoying your TradingView experience? Review us!
Please be advised that the information presented on TradingView is provided to Vantage (‘Vantage Global Limited’, ‘we’) by a third-party provider (‘Everest Fortune Group’). Please be reminded that you are solely responsible for the trading decisions on your account. There is a very high degree of risk involved in trading. Any information and/or content is intended entirely for research, educational and informational purposes only and does not constitute investment or consultation advice or investment strategy. The information is not tailored to the investment needs of any specific person and therefore does not involve a consideration of any of the investment objectives, financial situation or needs of any viewer that may receive it. Kindly also note that past performance is not a reliable indicator of future results. Actual results may differ materially from those anticipated in forward-looking or past performance statements. We assume no liability as to the accuracy or completeness of any of the information and/or content provided herein and the Company cannot be held responsible for any omission, mistake nor for any loss or damage including without limitation to any loss of profit which may arise from reliance on any information supplied by Everest Fortune Group.


08/11 Killer Sell Trade Patience pays in the stock market. I knew the downtrend was coming strong but I needed my usual signals:
1. Variation: Yellow
2. Wigle rejecting the opposite side: Blue to point out the wick.
3. Volume: I used a pending order waiting for it to come down to fill it.
I closed manually but i hit my 1.1 easily

Us30usd longThe first Dow Jones trade did not reach my entry point, I entered higher I am not responsible for the risk on the trade

Long us30usdThe first Dow Jones trade did not reach my entry point, I entered higher I am not responsible for the risk on the trade

Us30usd longDowJones Analysis and Trading for Tomorrow's First Week.
I am not responsible for taking risks.

US30--LONG--monthly,weekly,daily trend is bullish
--if price breaks yellow line, retest the black horizantal line enter the trade

US30 – Bullish Break Above 44,300.00After bouncing off 43,450.00, US30 surged past 44,120.00 and is now holding above the key 44,300.00 resistance-turned-support level.
Support at: 44,300.00 🔽 | 44,120.00 | 43,770.20
Resistance at: 44,700.00 🔼 | 44,922.00 | 45,136.10
🔎 Bias:
🔼 Bullish: Holding above 44,300.00 could fuel a rally toward 44,700.00 and beyond.
🔽 Bearish: A drop back below 44,300.00 may expose 44,120.00 and 43,770.20.
📛 Disclaimer: This is not financial advice. Trade at your own risk.

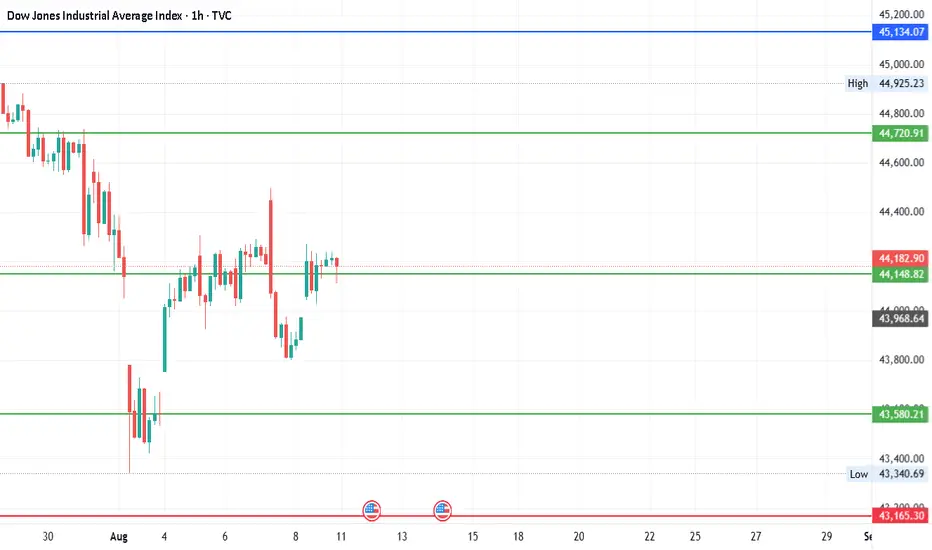
#DJI - Levels for Aug 2025Date: 09-08-2025
#DJI - Current Price: 44175.61
Pivot Point: 44149 Support: 43580 Resistance: 44721
#DJI Upside Targets:
| 🎯 Target 1 | 45134 |
| 🎯 Target 2 | 45547 |
| 🎯 Target 3 | 46072 |
| 🎯 Target 4 | 46596 |
#DJI Downside Targets:
| 🎯 Target 1 | 43165 |
| 🎯 Target 2 | 42750 |
| 🎯 Target 3 | 42226 |
| 🎯 Target 4 | 41702 |
#TradingView #Nifty #BankNifty #DJI #NDQ #SENSEX #DAX #USOIL #GOLD #SILVER
#BHEL #HUDCO #LT #LTF #ABB #DIXON #SIEMENS #BALKRISIND #MRF #DIVISLAB
#MARUTI #HAL #SHREECEM #JSWSTEEL #MPHASIS #NATIONALUM #BALRAMCHIN #TRIVENI
#USDINR #EURUSD #USDJPY #NIFTY_MID_SELECT #CNXFINANCE
#SOLANA #ETHEREUM #BTCUSD #MATICUSDT #XRPUSDT
#Crypto #Bitcoin #BTC #CryptoTA #TradingView #PivotPoints #SupportResistance
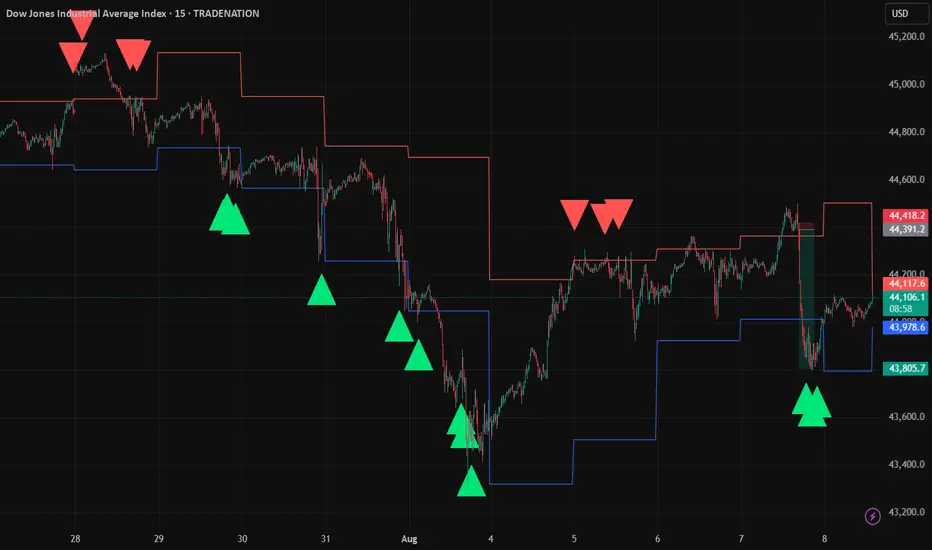
US30 Liquidity Grab Strategy – 15m Chart (1m Precision Entries)Description:
This idea showcases my Liquidity Grab Entry Signals strategy, optimized for US30.
The setup identifies daily high/low liquidity zones with a sensitivity buffer, then confirms reversals using strong engulfing candles.
Key Points:
Daily Liquidity Levels plotted automatically.
Buffer Zone detects price interaction with liquidity.
Engulfing Confirmation for higher probability entries.
Long when price rejects daily low with bullish engulfing.
Short when price rejects daily high with bearish engulfing.
While the precision entries are taken on the 1-minute chart, this 15-minute chart is shown for publication purposes in line with TradingView rules.
Example (Yesterday & Today):
Multiple clean rejections at daily liquidity zones.
Clear 1:15–1:20 R:R potential with minimal drawdown.
Risk Management:
Suggested SL: 10–15 points beyond liquidity zone.
Suggested TP: the next key level.
Precise 1 min entry shown here: