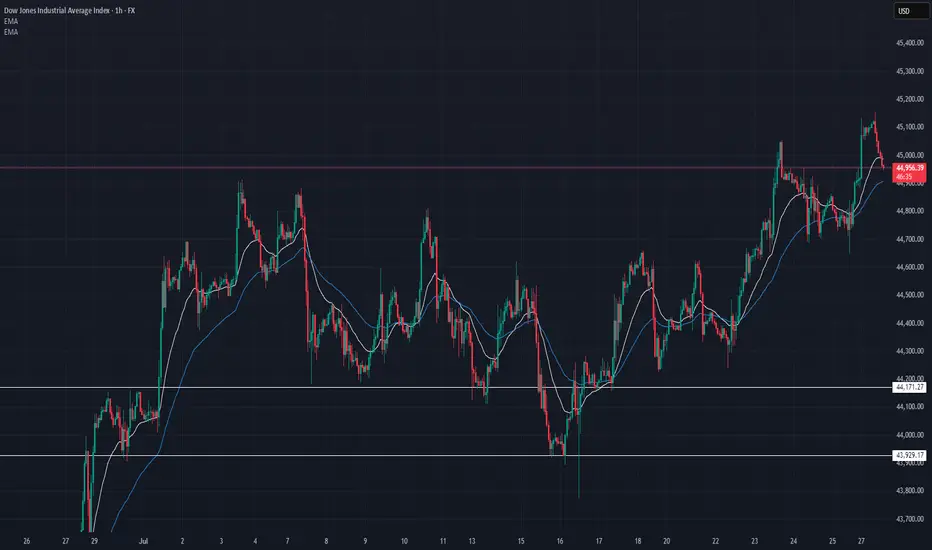
Dow Jones Industrial Average (DJI) – 1H Chart Analysis 1. Structure: Broad Range Consolidation
Price remains within a wide horizontal range between 45,137 resistance and 43,792 support. This shows indecision and distribution at highs.
2. Key Rejection Zone
The yellow zone around 45,001–45,137 acted as a strong supply area. Multiple rejections indicate heavy selling interest here.
3. Mid-Zone Compression
Current price is hovering just below 44,765 resistance — acting as a decision point. Break above it may retest the supply zone; rejection could send price lower.
4. Demand Holding at 44,280
The strong bounce from 44,280.25 shows buyers defending this demand zone. It's the key support to watch for bulls.
5. Next Play
Bullish: Break and hold above 44,765 targets 45,001–45,137.
Bearish: Failure leads to 44,280, then 43,973 → 43,792.
Neutral bias unless a clean breakout confirms direction.
DJIA trade ideas

US30 Sell analysis/ideathis trade is based on the 4-hour timeframe and executed using reversal trading and trend formation. Complete explanation in the video!

Safe Entry DJIObvious Movement I Guess.
P.High(Previous High) Act As good Support for price to Respect.
Note: 1- Potentional of Strong Buying Zone:
We have two scenarios must happen at The Mentioned Zone:
Scenarios One: strong buying volume with reversal Candle.
Scenarios Two: Fake Break-Out of The Buying Zone.
Both indicate buyers stepping in strongly. NEVER Join in unless one showed up.
2- How to Buy Stock (safe way):
On 1H TF when Marubozu/Doji Candle show up which indicate strong buyers stepping-in.
Buy on 0.5 Fibo Level of the Marubozu/Doji Candle, because price will always and always re-test the
US30 DOWN FOR WHILEWe have seen dramatic gain in most of the indices and US30 being one of them, and i have been tracking it for so long and i have come with this idea from my approach. As you can see on my screen i have labeled those levels and reset to mark up the the half cycle with the aid of the TDI divergence, the last push there is the level 3 moving exactly with the divergence which indicates that the bulls are getting weak and bears are about take over and push price to the downside, so am looking to join the bears 🐻to price down for a while.

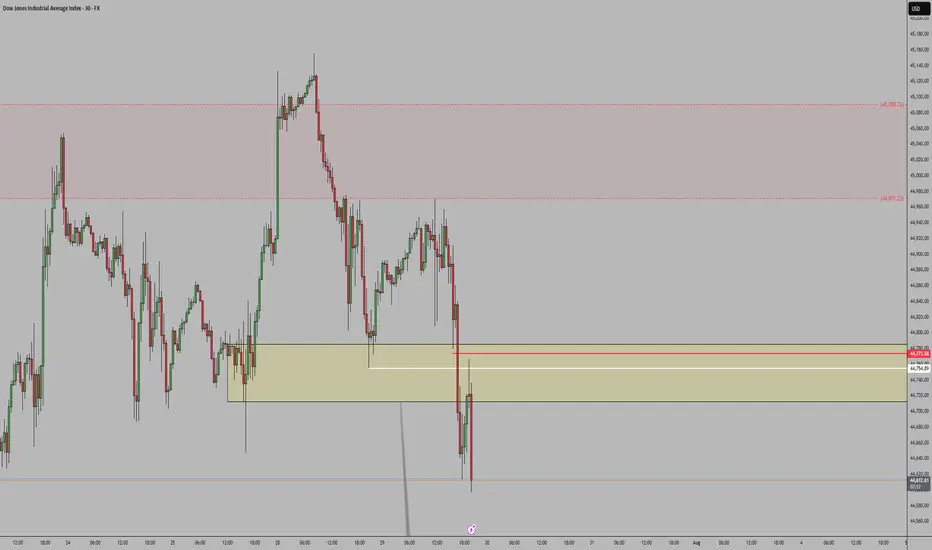
Dow Jones Index (DJI) – July 30, 2025 | 30-Min Chart Analysis
1. Current Market Structure
DJI is consolidating just below the intraday resistance at 44,777. Price is attempting to recover after a sharp drop from the 45,154 high.
2. Supply Zone Rejection
Price faced strong rejection near 45,154 and again at 44,968 — confirming this area as an active seller zone.
3. Support Zone Defense
Buyers stepped in at 44,587 and 44,403, creating a short-term demand base. These levels have provided stability for now.
4. Trend Outlook
The lower high formation and recent sharp sell-off hint at bearish pressure. Price is currently in a retracement — unless 44,968 breaks cleanly, sellers remain in control.
5. Key Levels to Watch
Resistance 44,777 → 44,968 → 45,154
Support 44,587 → 44,403 → 44,239
🔁 Bias: Short-term bearish unless price breaks above 44,968 and holds.

US30The latest COT report shows increased Non-Commercial short positions, indicating bearish sentiment among speculators. Commercial traders are also holding or adding to their short positions, reinforcing the negative outlook. Rising open interest further confirms market expectations of a decline in the US30.
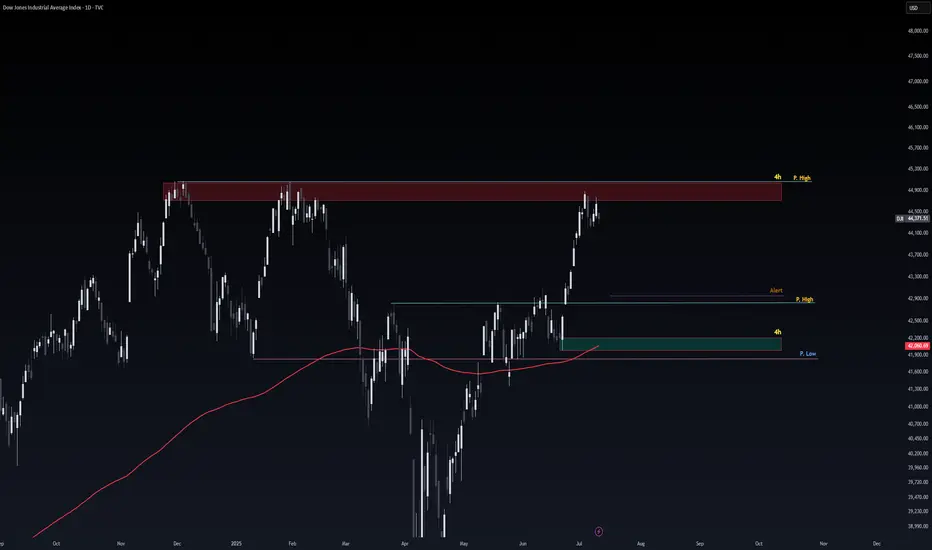
Dow Jones Index Analysis (US30 / Dow Jones):🔹 The index completed the expected correction and successfully retested the PDH level at 44,750 USD.
1️⃣ If bullish momentum leads to a break and close above 44,970 USD, the price is likely to form a new high or retest the previous peak.
2️⃣ However, a break and close below the 44,760 USD support could trigger a decline toward 44,660 USD.
🔻 A confirmed break below that level may resume the bearish trend and open the way toward 44,250 USD.
⚠️ Disclaimer:
This analysis is not financial advice. It is recommended to monitor the markets and carefully analyze the data before making any investment decisions.

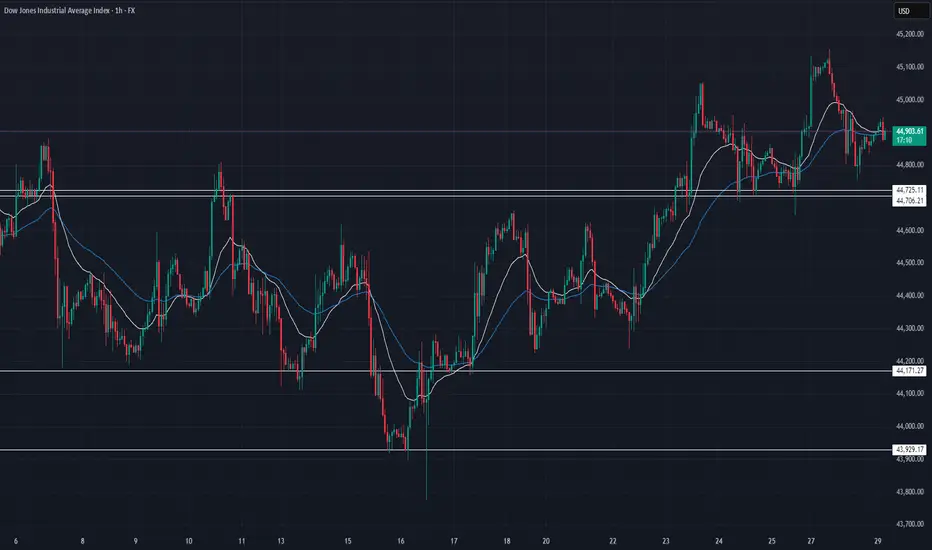
US30 Technical Breakdown – 07/29/2025📍 US30 Technical Breakdown – 07/29/2025
US30 is consolidating after last week's bullish breakout. It failed to hold above 45,100, rolled over, and is now ranging between 44,725 support and 45,000 resistance.
Currently sitting at 44,900, price is coiling just below key resistance. The market is waiting for a catalyst—either to reclaim 45,000 or dump back into the 44,700s.
📊 Current Market Behavior:
🔄 Sideways consolidation
📉 Lower highs forming below 45,100
🧱 Strong support building at 44,725
⚠️ No strong momentum yet – patience is key
📌 Key Levels:
🔹 Resistance Zones:
45,000 → Intraday ceiling
45,100–45,160 → Recent high/rejection area
45,250 → Breakout expansion level
🔹 Support Zones:
44,725–44,700 → Crucial support for bulls
44,600 → Mid-range support
44,171 → Demand floor
🧠 Bias:
🔄 Neutral to Slightly Bearish Intraday
Price stuck between 45,000 resistance and 44,700 support
Bears in control unless we break & hold above 45,000
Look for signs of momentum at open
US30 DOW JONESwe are stopping losses tiks above previous high, Shorting chasing the last low 1:1, 1:2

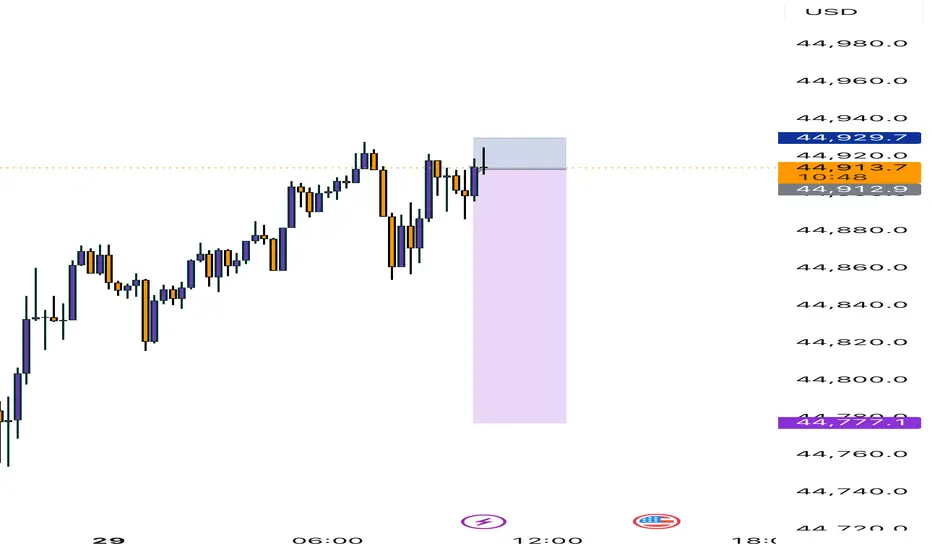
US30: : Local Bullish Bias! Long!
My dear friends,
Today we will analyse US30 together☺️
The recent price action suggests a shift in mid-term momentum. A break above the current local range around 44,802.50 will confirm the new direction upwards with the target being the next key level of 44,914.32 and a reconvened placement of a stop-loss beyond the range.
❤️Sending you lots of Love and Hugs❤️
US30 5M DEMAND SETUPPrice was in a clear bullish trend, consistently printing higher highs. Two demand zones were formed, followed by a clean break of structure. I anticipated a reaction at the most recent demand zone and entered on a strong rejection candle, leaving the wick in zone. Execution was on the break of candle with initial targets set at recent highs. However, unexpected momentum drove price beyond target, allowing me to secure a solid 1:2 R:R. Trade managed with discipline and am satisfied with the outcome.

"We are going higher than 45,135.78The Dow Jones has the potential to start an upward move from the 44,811.77 and 44,732 levels, aiming for 45,135.78." CMCMARKETS:US30

Getting ready for new highs Price tested the 45000 resistance which is the final resistance before new highs, it is now going down to test the trend line support of the uptrend channel
US30 Weekly Forecast – Bullish Bounce or Breakdown?Hope everyone had a great weekend!
This chart outlines a critical US30 intraday structure with price currently pulling back into a key confluence zone composed of:
A rising trendline from July 23rd
Two stacked demand zones, the upper around 44,850 and lower near 44,700
Bullish Scenario (Preferred Bias):
If price respects the trendline and upper key zone, we may see a bullish continuation targeting the 45,150–45,250 range.
The clean bounce zone, marked by the green arrow, suggests smart money might defend this level.
Watch for bullish engulfing or low-volume traps near 44,850–44,880 to confirm entry.
Bearish Scenario (Alternate Play):
If price fails to hold the trendline, and breaks below the 44,850 key zone with momentum, expect a drop into the lower zone (44,650–44,700).
A breakdown below this lower demand could shift the bias entirely, opening the door for a deeper correction back into the mid-44,000s.
Weekly Playbook:
Early week: Monitor the reaction at the upper key zone for sniper long opportunities with tight stops.
Mid to late week: If structure fails, flip bias and look for supply rejections on retests for shorts.
Risk: Account for FOMC/major U.S. news events that may introduce volatility traps around these zones.
Verdict: Stay patient. Let price dictate bias at the trendline. If it holds, this could be a textbook bounce continuation setup.
US30 Market Breakdown – 07/28/2025📍 US30 Market Breakdown – 07/28/2025
US30 just broke above the prior key zone at 44,950–45,000 and tapped 45,160+ before showing some rejection and pulling back to 45,000.
The move confirms bullish continuation—but the pullback is critical. If bulls defend 44,950–44,900, this could be a textbook higher low and launchpad for more upside.
📊 Current Structure:
✅ Higher highs & higher lows
📈 Clean break and retest of the 45K zone
⏳ Pullback in progress—watching demand areas
🧱 Resistance Zones:
45,160 → Recent local high
45,250 → Psychological resistance
45,400 → Next extension zone
📉 Support Zones:
44,950 → Breakout level (must hold)
44,800 → EMA confluence
44,600–44,500 → Demand base
📉 If price fails to hold 44,950, we could see a fade back to 44,800 or even 44,600.
📈 If 45,160 breaks, expect momentum to accelerate into the 45,300–45,400 range.
🧠 Bias:
🟢 Bullish
Structure favors continuation unless 44,800 breaks
Buy dips into demand zones
Wait for NY open confirmation for intraday momentum
People pay for this!!!If you are a beginner trader struggling with entries then this video is for you.

All time high reachedas presented in last post, US30 all time high reached via beautiful bull flag, its not over yet, fill the gap and go for more
Dow Jones Index Analysis (US30 / Dow Jones):🔹 The index recently tested its all-time high at 45,152 USD, and a short-term correction may occur to retest the PDH level at 44,950 USD.
1️⃣ If strong bullish momentum leads to a break and close above 45,150 USD, the price is likely to push toward forming a new high.
2️⃣ However, a break and close below 44,620 USD could trigger a move toward 44,240 USD.
🔻 A confirmed break below this zone would resume the bearish trend and open the way toward 43,900 USD.
⚠️ Disclaimer:
This analysis is not financial advice. It is recommended to monitor the markets and carefully analyze the data before making any investment decisions.

DOW JONES INDEX (US30): Another Gap For Today?
I see another gap up opening on US30 Index.
I think it will be filled today. A formation of an intraday
bearish CHoCH on an hourly time frame suggests
a highly probable bearish continuation.
Goal - 44943
❤️Please, support my work with like, thank you!❤️
I am part of Trade Nation's Influencer program and receive a monthly fee for using their TradingView charts in my analysis.

US30 H4 IdeaThe Federal Reserve meets next week and is widely expected to leave rates unchanged at 4.25%–4.50%. Still, market participants will watch for commentary on inflation and rate-cut prospects, especially after recent criticism of Fed Chair Powell by President Trump.
What Should Traders Watch?
With the major indexes on track for weekly gains, next week’s developments could test the market’s resilience.
