Real rates down... silver up!My brain seems to think on a different wave length before I have my morning breakfast... or 1st coffee! More CCI defined fuel for real rates to go down... and silver up! #patience #gold #silver $slv $gld #fintwit $sil $silj $gdx $gdxj $dxy
FEDFUNDS trade ideas

Evictions Galore - Prepare for some more Fed Rule-BreakingWell it's starting:
www.washingtonpost.com
Unpaywalled article about the same thing:
money.yahoo.com
So many Americans, 45% of whom*, who do not even have a dollar in savings, and most of those are lower-class, nonsavers who are renters who don't get the benefit of forebearance, are now facing the ensuing reality that we don't live in a benevolent despotate where the king can just forgive all the poor peasant saps. Instead, we live in (the remnants of) a free market, capitalist nation, that runs on "make money or fuck off" (kinda... sometimes.... well if you're not disabled, nonwhite, a woman, or have kids).
www.statista.com * Easily way worse nowadays
It looks like the reckoning is nigh, and we are about to face another good lot of craziness for a couple months (or maybe more if we are lucky). We have a load of debtor, drunkard Americans who work unskilled service jobs about to be homeless, or are already packing their bags. Meanwhile, many American homeowners are being saved, for the time being, by forebearance. On the other hand, there are issues like this*, 9/10 New York businesses not being able to pay full rent.
nypost.com
So what do we do with all this information? What does it tell us about the future? Much similar to my last article, there is a coming big change to the way debt will have to be handled as to prevent a massive bust - in this case, prevent millions of Americans becoming homeless within a few months to a year. If so many of these nonsaving, generally low IQ, probably prone to anger (vengeance-seeking is an attribute of lower IQ people. Can't control impulse.) people are going to lose their fancy leveraged lifestyles they have been given on a silver platter by a thieving government (that stole it from the Chinese and all the other third worlds that could benefit from taking back what they've been giving us for decades) then they'll probably wanna start rioting and throwing up signs about how angry they are, maybe even start hurting people they deem blameworthy.
Where do we go from here? There'll have to be massive action from congress and the Fed. That's it. The dollar is gonna have to take a big ole kick to the teeth to prolong the damage that has been done by the onset of sober reality to our nonexistent economy. I think the couple months of waiting for something to happen will pay off by the end of the year when either we have another nice drop in the stock market (making Donald Trump shart his pants), or the Fed enacts that beautiful cryptocurrency*, lowers rates, buys corporate bonds, delivers bailouts, or finds some way to unconstitutionally defy the law written for them.
www.bis.org


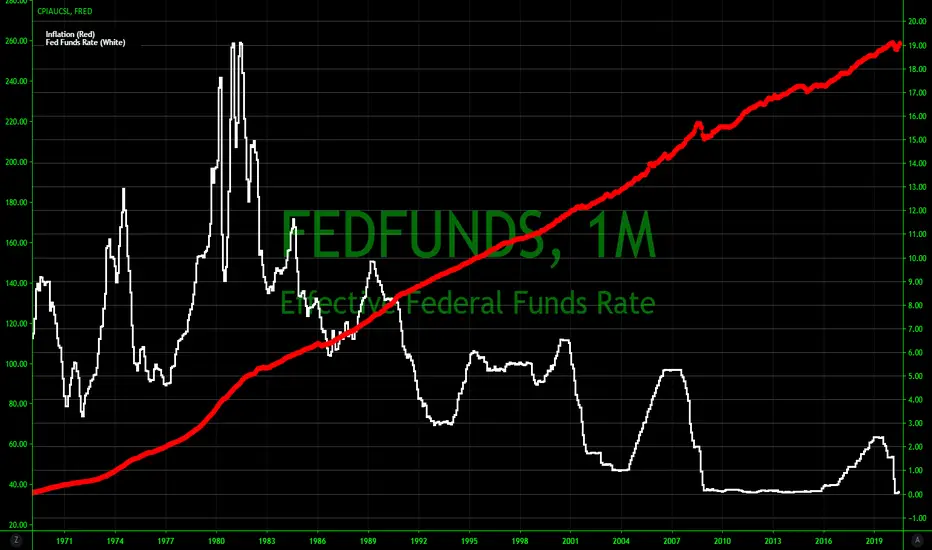
Similar chart, but drilled into a bit deeper. Rates/InflationThis chart bodes well for manufacturing, and real estate, equities and commodities.


How long will Fed keep this extreme low rates?Fed kept rates this low from 2009 to 2016. How long will it be this time?

How Long will Fed keep extreme low rates?Fed kept these low rates from 2009 to 2016. How any years will it be this time?

Yield curves all back above zero - market pumpingWhen interest rates hit zero, all the equations blow up toward infinity and beyond... so yeah, markets still can go up and appear "undervalued" when debt is basically free.
The crash can happen at any day now - no one knows.

Past recessions compared to interest rates+productionTo me its just blaringly obvious that in the coming year(s) theres a recession going to happen, alot of people agree and very many disagree, this however, is bulletproof.
Obviously there isnt a recession until its actually happening so act accordingly, dont trade based on inverse yield lol

GOLD, SPX AND FUND RATES/QEAs mentioned in the previous idea, for Gold to go up we need 2 factors:
1 - market crash from hyperinflated values
2 - fed intervention in the form of rates cut / quantitative easing to make it attractive
I would not consider what happened to gold before 2006, when it seems that it is perfectly correlated with spx, simply because in 2000 an ETF on gold was introduced, bringing in a lot of liquidity to the underlying. Before it was difficult to buy gold if not with futures. It became mainstream.
Let's concentrate on what happened from 2007 onwards, without concentrating too much on levels, but more on timings in a cause-effect analysis.
Spx was coming from a 4-year bull run after the .com bubble, prices were going beyond any common sense, bubble fears were increasing, interest rates were high at 5.25%: all the ingredients for a recession were there.
After freddy mac and fanny mae defaults, FED started to cut rates until the abrupt cut from 4 to almost 0 in Nov 08, which was "incidentatally" the point in which gold reached its local mininum and experienced its bigger loss in years. Until rates are not cut indeed, a financial crisis itself does not make gold attractive to investors, as their liquidity can be used with bigger returns elsewhere (also it is needed to keep the business open in the intitial phase of the downturn). The market continued to fall until march 09, while gold started its incredible run to 1900usd.
In 2012, when the FED announced a progressive return to "normal" rates situation, gold started to decline and fell asleep for many years as no more attractive to investors during the EVERYTHING BUBBLE. Until 2019, when, amid bullish markets, fears of another recession started to mount again. Everytime gold, even if sleeping, sets to a higher level: 600 in 2008, 1000 in 2015, 1400 could be the one at the present time.
Now, markets are crashing and FED just announced a rate cut to 0. Can you see the dejavu?

All the yield curves heading inverted... not a good signNot a good sign for coming recession indication - it's almost a sure bet now with Coronavirus... and once market agrees it's recession for sure, things get UGLY.

Financial Shock Indicator - Recession Prediction ToolI've been looking around for various data tools to indicate recessions catalysts and their relationships to financial indicators over the past few months. From those efforts, I've honed in on a particularly interesting ratio that seems to indicate financial shocks that spark recessions (indicated with green shading). It looks like when you take the Fed's Interest Rate (FEDFUNDS) and divide that by the spread of the 10Y (TYX) and 5Y (FVX) treasury bond you get inverted peaks that mark times when a severe financial shock has been applied to the US economy. The delineating factor on if it will truly trigger a recession or not, I think, hinges on the nature of the disruption.
You can see with the Clinton Impeachment, there wasn't a resulting recession. There were issues present the caused the fed to cut rates during those times, but apparently the cause wasn't significant enough (Asian and Russian Financial Crisis). So, I ask myself, is Trump's Tariff War significant enough of a shock to trigger a recession? The Q3 GDP doesn't seem to indicate it, but a look back at the 2000 bubble shows a similar trend. Trump's Tax Cut (giving a boost to the GDP in a low sales time period) may be insulating the US economy from a true recession, but it's not clear.
There may be a better data set to plot this out further, which I'll be working on, to see how it aligns with more than the previous 2 recessions but I wanted to get this out there for people to weigh and challenge. My other comment regarding applicability is that Cam Harvey's inverted yield curve can be set up with a variety of combinations. In the Duke article published in July of 2019, Harvey himself describes the recession indicating inverted yield curve as the difference between the 10 year and 3 month treasury bill in an inverted state for an entire quarter. That event did not occur in 1998. So, the combination of the Financial Shock Indicator with a preceding inverted 10yr-3m yield curve for more than a quarter gives you a 100% chance of recession (from an n=2).
Either way, I think my Financial Shock Indicator, when used with the inverted yield curve, may be indicative of true recession predictions. But we'll see how it turns out.

Fed Funds Rate- Interesting patternsWas just taking a look at the rate and noticed the EMA. 200 EMA is currently at 1.71 with the 10 day at 1.86.
Black horizontal lines are approximate time when 10 day crossed below 200 day. Purple are the listed start of a recession.
Just found this interesting and especially since it's on 15 bp away from crossing to the downside again.
You'll also notice that it crosses back down within 6-12 months of crossing to the upside (in the last 30 years).
1977-1985 are exceptions to the 6-12 months and did not cross to the downside around a recession (recession of 1980 and 81-82 fell in between)
Take this how you'd like, but it's definitely a good idea to at least take something (whether bullish or bearish) from this.


Fed Funds RateGoing to 0 and beyond. One of the few charts that can go in the negative. Lower highs and lower lows for 30 years. Once the market catches wind of lower interest rates it can't get enough. It's a race to the bottom for all developed world interest rates. To full investment and then what happens? The real problem is the velocity of money keeps dropping with every drop in interest rates. Why sell something if it is always going to be worth more?
The only answer is to buy Bitcoin of course.


Federal Funds Rate % - Compared to Monetary BaseTake notice how correlated the lending rate is to the rate of fiat dollars printed.
All that money was printed at 0% interest.
Now, rates are going up and the printing presses are cooling down.

$FEDFUNDS decreases in August, Repeat October 1987?The 2 year yield is dropping fast and the FED is forced to follow. We have a 100% probability of a September rate cut.
$TLT $IEF $SPY $GLD $SLV $GDX $QQQ $IAU

Pop Bottles (Rate Cut)Federal Reserve Rates Cut to 2% (0.25% cut) coming back into the system. $75 billion on the repo announced. Lambos.


Fed Funds Rate Predicts Market Downturns?The last couple of times there were financial problems with the Fed and they started messing with rates. As you can see each time there is a down turn in recent history we've had historical corrections to the down side or extreme bear markets.
It looks like we're rolling over yet one more time. What will they do tomorrow? Lower the rates? Start up QE Infinity?
Everything is in bubble territory. I remain long on metals.
Stay safe everyone

Have Federal Interest Rates Peaked? -1.8% projection.Simple chart showing the federal funds rates since 1955. As you can see the rate is currently in a falling wedge pattern which should eventually break to the upside. However given the conditions of the global economy, for now, we may very well be at the peak at the top of the channel with a downward move pending.
If this happens to be the peak and feds continue to cut rates from here, we could see interest rates at -1.8% or lower by the end 2020 / beginning of 2021. The time is derived by the last two drops from the top to the bottom of the channel which took ~460 days.
