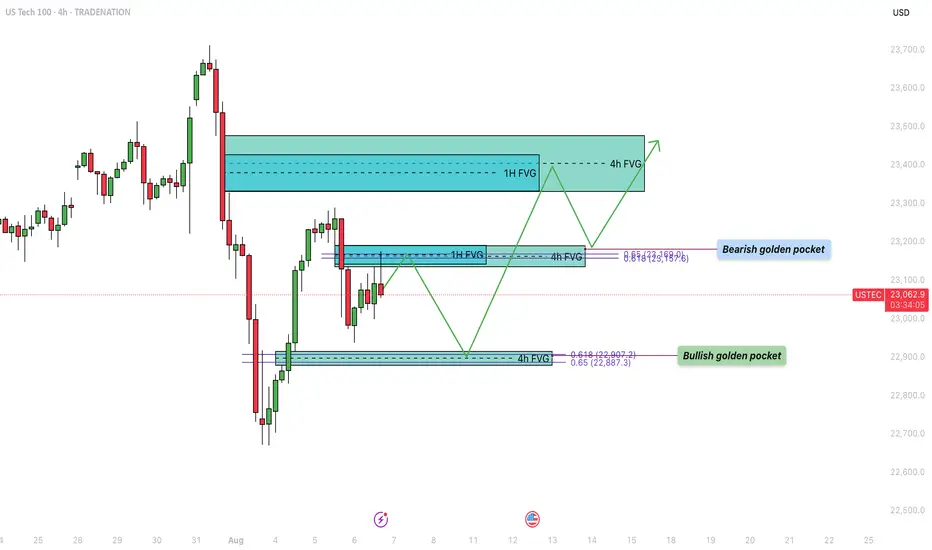
US100 - Bullish trajectory to fill the inbalance zones!Over the past week, the US Tech 100 (US100) experienced a sharp decline, dropping into a significant support zone. During this bearish move, several fair value gaps (FVGs) formed on both the 4-hour and 1-hour timeframes, which remain unfilled. Currently, price action is retracing upward, aiming to f
About NASDAQ 100 Index
Related indicators
US100 Builds Momentum Toward New HighsUS100 Builds Momentum Toward New Highs
Since yesterday, the US100 has climbed by nearly 1.4%, rising from 23,223 to 23,550.
The bullish trend is strong, and it looks like US100 is preparing for a bigger upward move—possibly aiming to set a new all-time high.
Before continuing higher, US100 may f
NASDAQ Potential UpsidesHey Traders, in today's trading session we are monitoring NAS100 for a buying opportunity around 23,300 zone, NASDAQ is trading in an uptrend and currently is in a correction phase in which it is approaching the trend at 23,300 support and resistance area.
Trade safe, Joe.

US100 Technically Move Up HeadThe US100 has seen multiple pullbacks of around 3.5% to 4% over the past week. However, each dip has been met with strong buying interest, leading to quick recoveries — indicating that these were bullish pullbacks, not trend reversals.
This kind of price action typically reflects underlying market
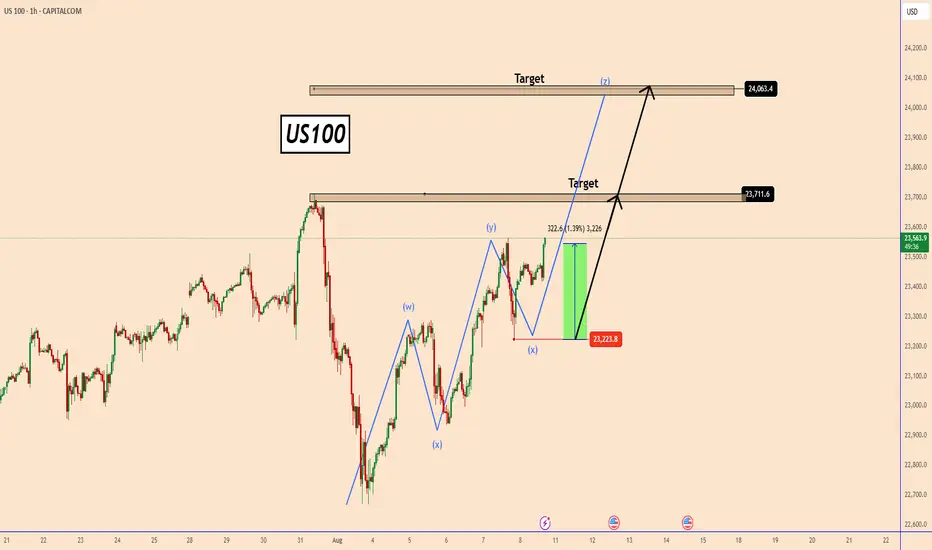
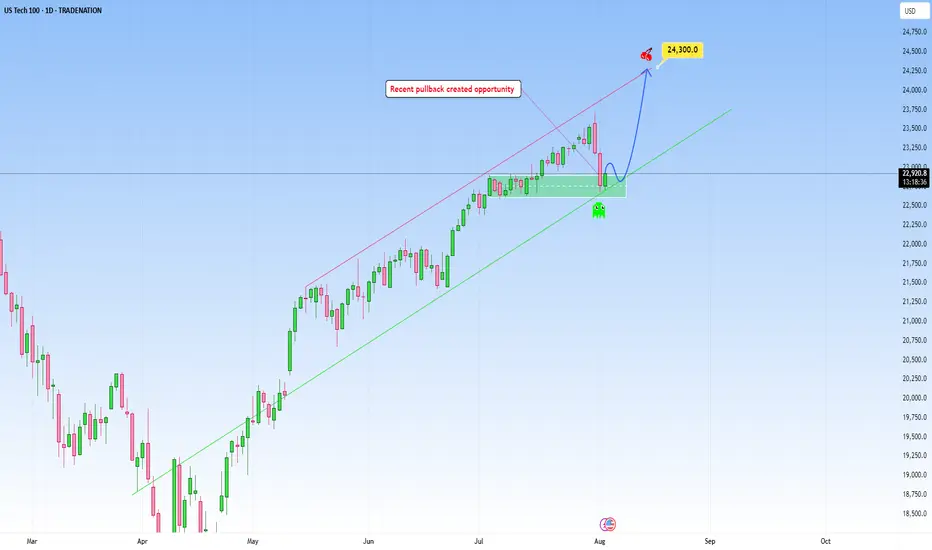
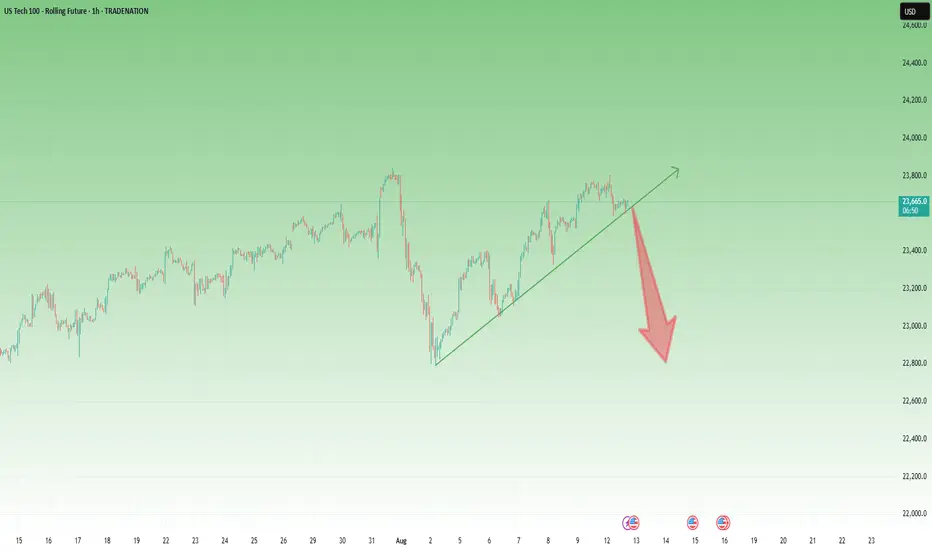
USTEC: Likely continuation following pullbackNAS100 climbed a steep uptrend and my expectation is for a continuation as marked on my chart, with an upside target at around 24,300.
This area here is where it can become a decision point, either price finds support and bounces, or it breaks below, and that’s when we might see the move start to e
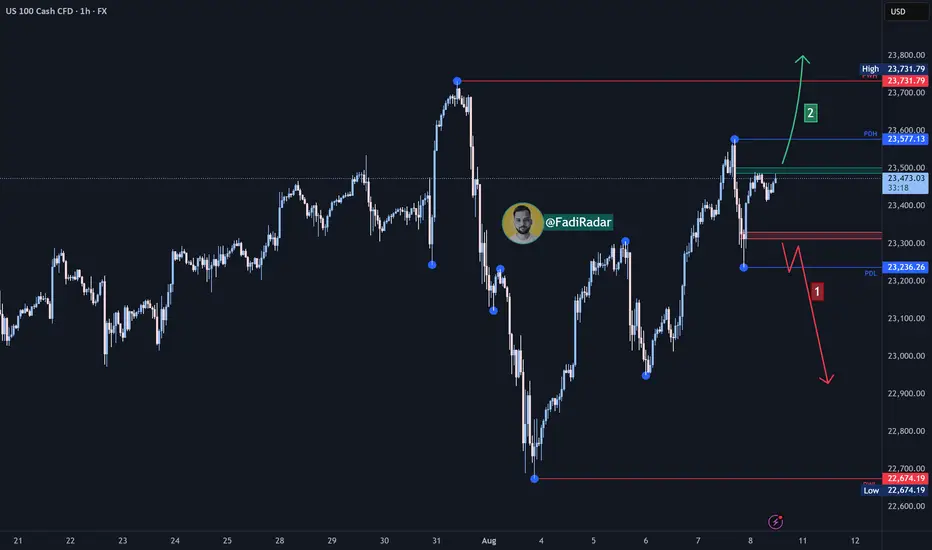
Nasdaq 100: Institutional Move Toward 22,680 Unfolding📊 Nasdaq 100 Smart Money Breakdown
Current Price: 22,103
Target Price: 22,680
🔼 Upside Potential: +577 points
The market is currently positioned for a premium retracement move after a recent liquidity sweep below short-term equal lows, which likely triggered sell-side liquidity. This setup hints a

US100 – Dark Cloud Cover Signals Possible Reversal AheadAfter the drop to 22,800, NAS100 recovered strongly and yesterday retested the recent ATH in the 23,800 zone.
However, by the close of the trading day, the index erased the entire intraday advance and closed in the red – leaving a Dark Cloud Cover candlestick formation on the daily chart.
As expla
US100 Bullish Momentum Targets AheadThe US100 shows strong bullish structure after completing an ABCD correction, with price eyeing a potential move towards the 1st target at 23,791 and possibly the 2nd target at 24,053. A brief pullback may precede the continuation towards these key resistance levels.
1. Current Structure
The chart

Nasdaq bull flag forming with a sweet entry.I think we've got a bull flag forming on the hourly on the NASDAQ. I think we need to take out this wick. And I think we come down and take out these stops just above where the red box is. And I think that's a pretty sweet entry before we go to new all-time highs. Um, let's see what happens. Hope y

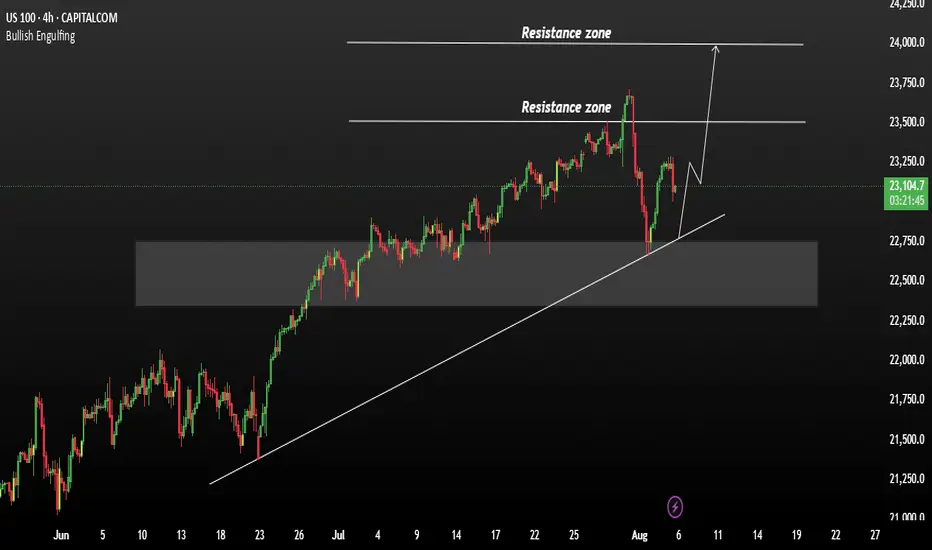
NASDAQ Index (US100 / NASDAQ) Analysis:The NASDAQ index has shown strong bullish momentum recently and is currently trading near a key resistance level at $23,500.
🔻 Bearish Scenario:
If the price fails to break above $23,500 and selling pressure emerges, we could see a downward correction toward $23,310. A break below this level could
See all ideas