USNAS100 – Bearish Below 22900 as Earnings & Tariffs Hit MarketUSNAS100 – Bearish Bias Ahead of Earnings, PPI & Tariff Tensions
S&P 500 and Nasdaq futures are slightly lower as traders weigh rate outlook, tariff developments, and major earnings reports.
📊 Earnings in Focus:
Goldman Sachs NYSE:GS , Morgan Stanley NYSE:MS , and Bank of America NYSE:BAC are set to report today.
JPMorgan Chase NYSE:JPM and Citigroup NYSE:C posted strong results yesterday, but expressed caution over U.S. tariff policies.
🌍 Tariff Watch:
Trump announced a 19% tariff on Indonesian goods, with more deals anticipated ahead of the August 1 tariff deadline. The EU is reportedly preparing retaliatory measures if negotiations stall.
🔧 Technical Outlook:
The Nasdaq100 shows bearish momentum as long as it trades below 22900 and 23010, with potential downside targets:
Support: 22720 → 22615 → 22420
Resistance: 23010 → 23170
To shift back to a bullish trend, price must stabilize above 22900 and break 23010.
Key Events Today:
• Corporate Earnings
• Tariff Developments
• U.S. PPI Report
NDQ100 trade ideas

Wedge Cracks + Tariff Heat = Bearish Setup On US100The US100 is showing signs of potential reversal after completing a harmonic ABCD pattern near the wedge resistance. The price has broken below the rising wedge support, indicating bearish momentum.
Bearish Confluences:
1) Completed the ABCD pattern
2) Rsisng Wedge Breakdown
3) Clear Bearish RSI Divergence, showing weakening momentum at highs.
Targets:
TP1: 22180
TP2: 22050
TP3: If the price breaks below 22050, then TP3 will be 21650

[BUY] Bullish ORDERBLOCK Demand ZoneBreak of structure at the daily creating a higher high
Entered longs at the demandzone/orderblock as highlighted.
SL at daily support (higher low)
Target recent highs at 22,920
COT data indicates that last week, institutions continued to buy NASDAQ heavily.

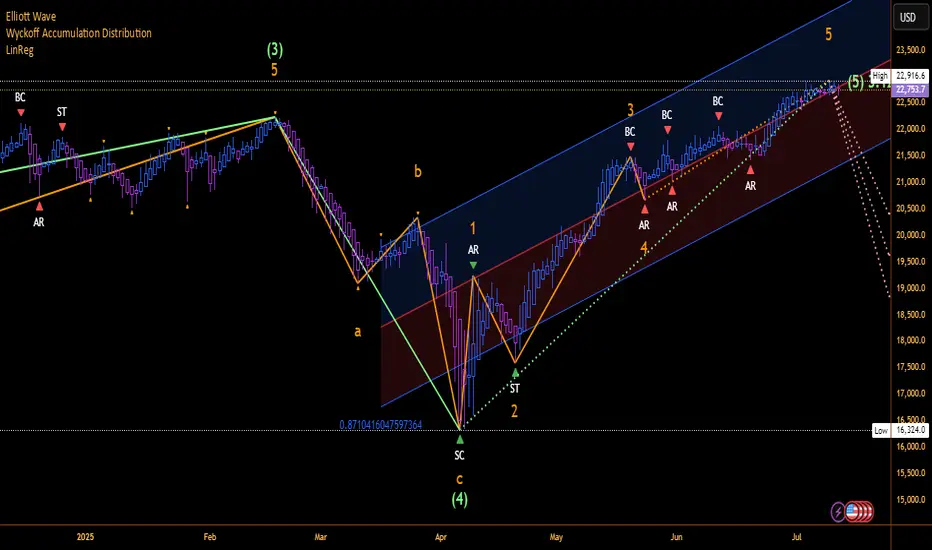
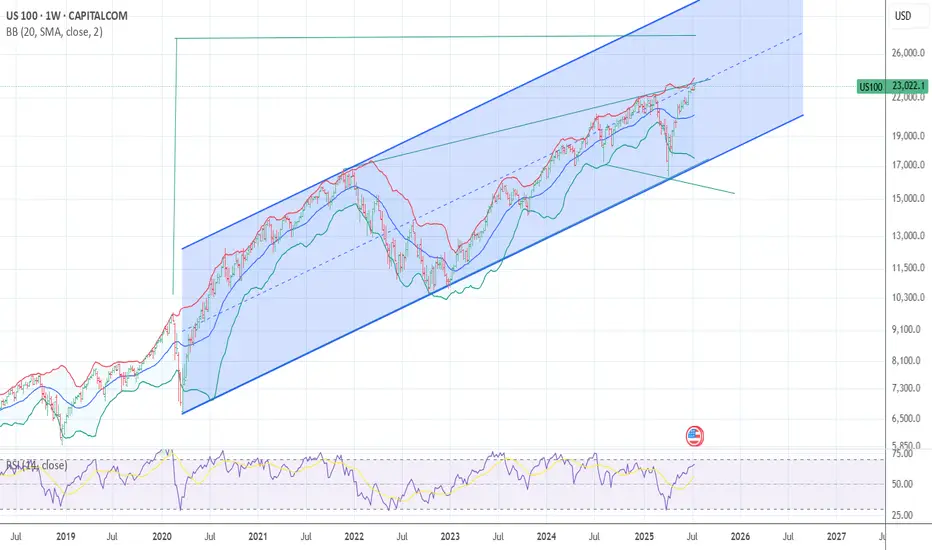
NASDAQ 100 MAJOR REVERSAL SETUP/VOLUME WANINGElliott Wave Theory is a wonderful forecasting tool that provides confluence in conjunction with many technical such as the MFI, Awesome Oscillator, and Bull Bear Power.
Indicators such as Moving averages and ALL Chart Patterns just to name a few, beautifully align painting an amazing roadmap of reversals.
Motive wave in Green, Corrective wave in Pink
Orange Waves are sub waves.
Solid lines are completed, whereas the dotted lines are in progress. The likelihood of a wave count becoming invalidated has a lower probability on higher timeframes for example Day/Week/Month, whereas on lower timeframes such as 1 minute to 5 minute. I've observed wave count invalidation/recalculation of the wave counts more frequently.
With all the news of Tariffs and such the Elliott Wave follows the data, buy/sell side, liquidity, and volume.
Speaking of volume:
April Vol was 15.39M
May Vol was 10.74M
June Vol was 9.04M
As of July 11th it is at 3.37M with 17 trading days to go.
Don't get BULL trapped!!
HAPPY TRADING
Risk off The cycle low is due 10/10 -20th The Bullish wave count is that we are ending wave 1 of 5 in super cycle blowoff wave 2 would drop in a ABC decline and drop back to .382 alt 50% of the whole rally from 4835 low . This is the bull wave count ! The bearish wave count is that we are ending the final 5th wave up from 2020 low march 23th see my work calling for a panic into 3/18/3/20 2020 the low was 3/23 20 into perfect math at 2191 as was the call for 3510 to 3490 low and the 4835 low all are in near perfect math . My worry for this oct 10 to the 20th Is I see a 1987 like decline taking out the 4835 in a wave E CRASH . Under all three counts I moved to a 110 % short. best of trades WAVETIMER
Bearish Momentum Builds Below pivot zone USNAS100 Analysis
Price has reversed from its ATH and now shows bearish momentum.
Below 22705, downside targets are 22615 and 22420.
Bullish scenario only valid if price breaks and holds above 22815.
Pivot: 22710
Support: 22615, 22420
Resistance: 22815, 22910

Possible Sell Entry1. CHoC
2. Order Block to be balanced
3. Sell momentum continues
4. H & S pattern also indicating sell

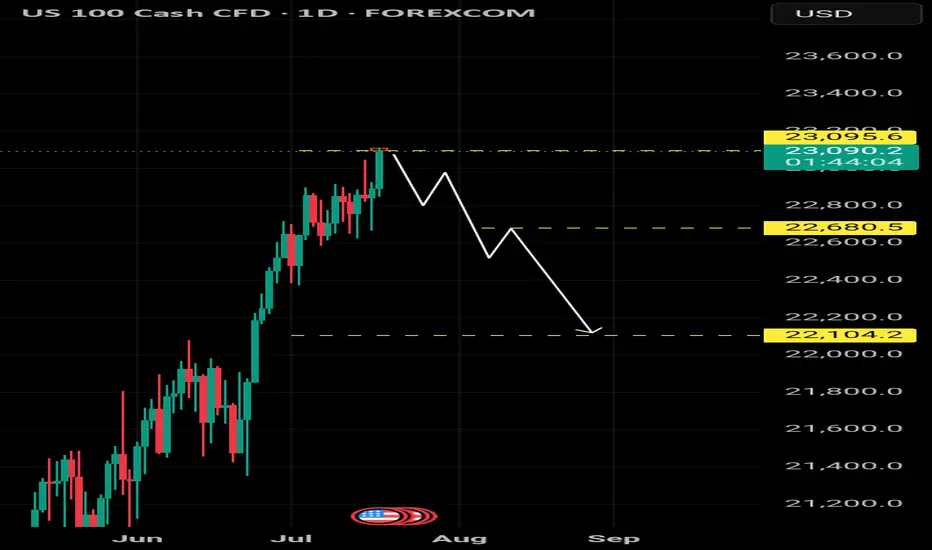
NASDAQ Outlook – Coming WeeksIn the coming weeks, we may see a potential downward move in the NASDAQ, provided that it fails to hold above the current level at 23,100.
If the index remains unstable below this level, a sharp decline toward the 22,800 zone is likely.
short on nas100I'm looking to short US 100 around the 22,840–22,850 supply zone, where price has previously shown strong rejection. I’m expecting a reversal from this resistance area, targeting the 22,660 level as my take profit. My entry is around the current price, and I’ve placed my stop loss just above the zone at 22,875 to manage risk. This setup gives me a clean structure and a solid risk-reward ratio for the move down.

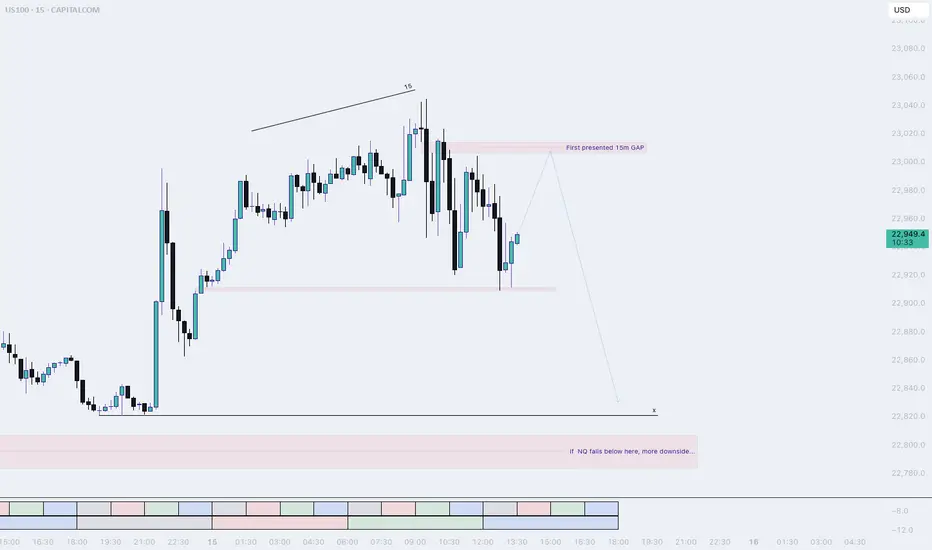
NQ, PM session (Tuesday) (long into short idea)Most likely price will make one more pullback before dropping into sell-side liquidity.
The laggish price action tells us that NQ is not really done IMO. I think a retracement into the 15m Gap is doable for NQ.
Keep watching NQ afterwards, We want to see a sudden drop to confirm our down movement.
US100 Short From Resistance!
HI,Traders !
US100 is weaker than we
Expected and failed to break
The key horizontal level
Around 22868.6 and we are
Now seeing a bearish rejection
So we are locally bearish biased
And we will be expecting a
Further bearish move down !
Comment and subscribe to help us grow !


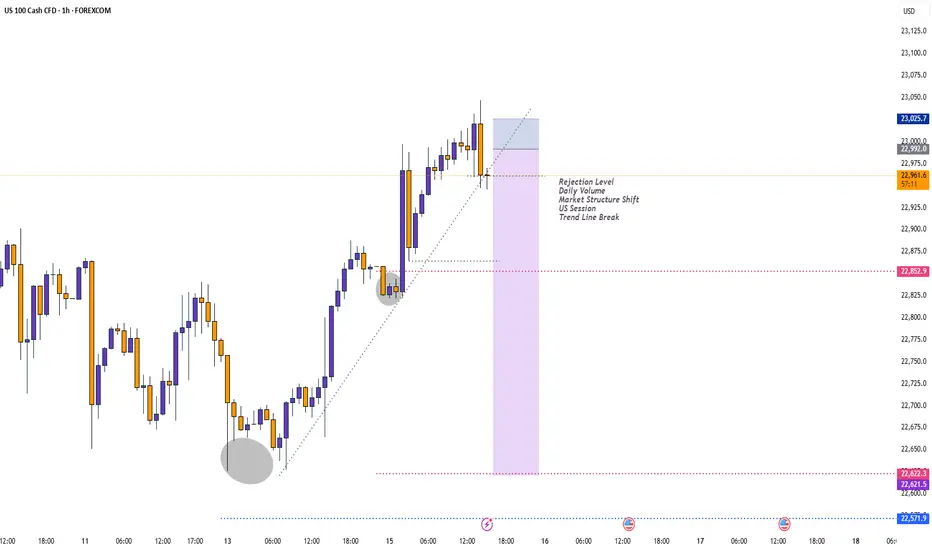
US100 H1 TECHNICAL ANALYSIS.US100 currently trades at 22830 what’s the next potential move on this asset? A reversal to 23024 high or a further decline to 22680. Let’s watch out and see how price reacts at that level.
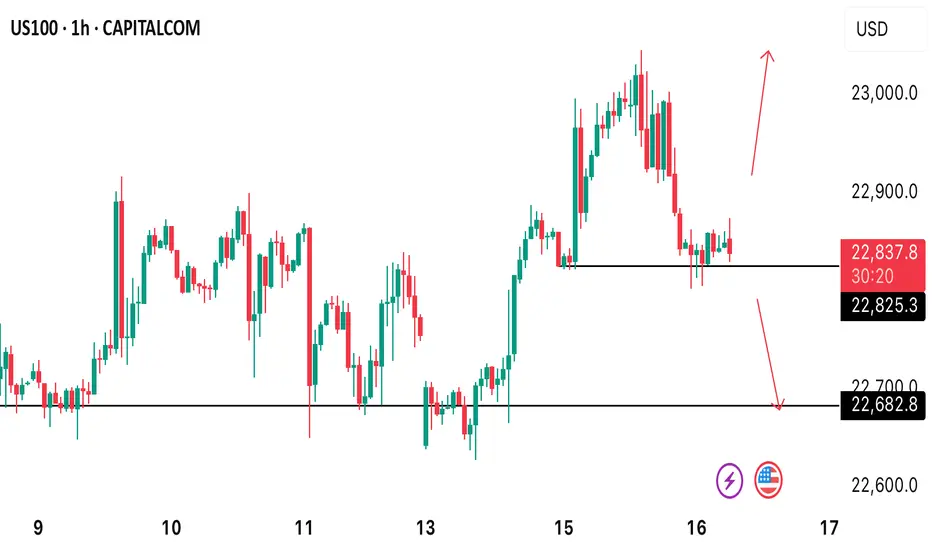
SellRejection Level
Daily Volume
Market Structure Shift
London US Session
Trend Line Break
Untapped Order Point
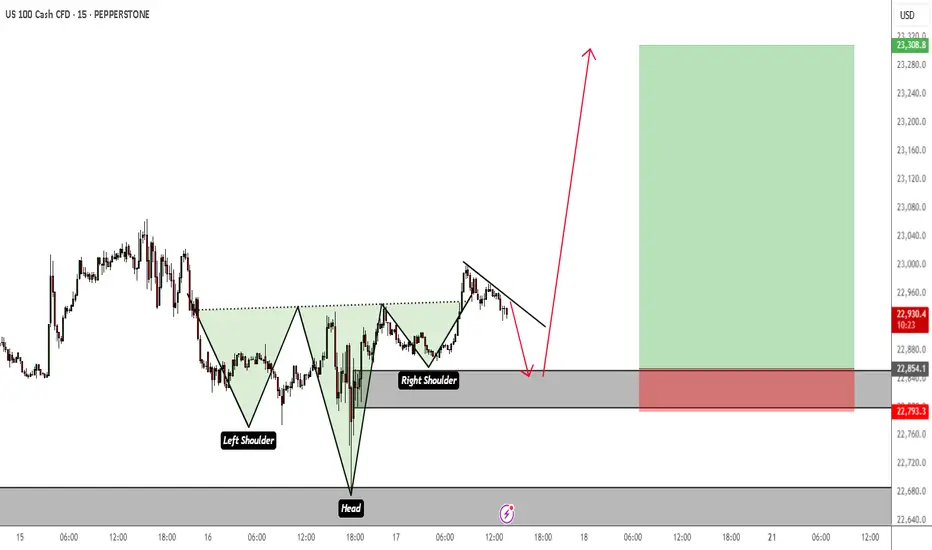
NASDAQ Inverted Head & Shoulders Retest Before Bullish MomentumI see a possible retest of an Inverted Head and Shoulders on M15 TF before the bullish momentum resumes. The SL and TP are just a rough estimation. Price could dip a bit lower than that.
But my overall bias is bullish.
NASDAQ 100 | BearishNASDAQ has formed divergence on RSI.And NASDAQ plays divergence almost all the times.Considering it will honor the divergence then NASDAQ is going to enter into a strong correction phase and it may test its support zones.

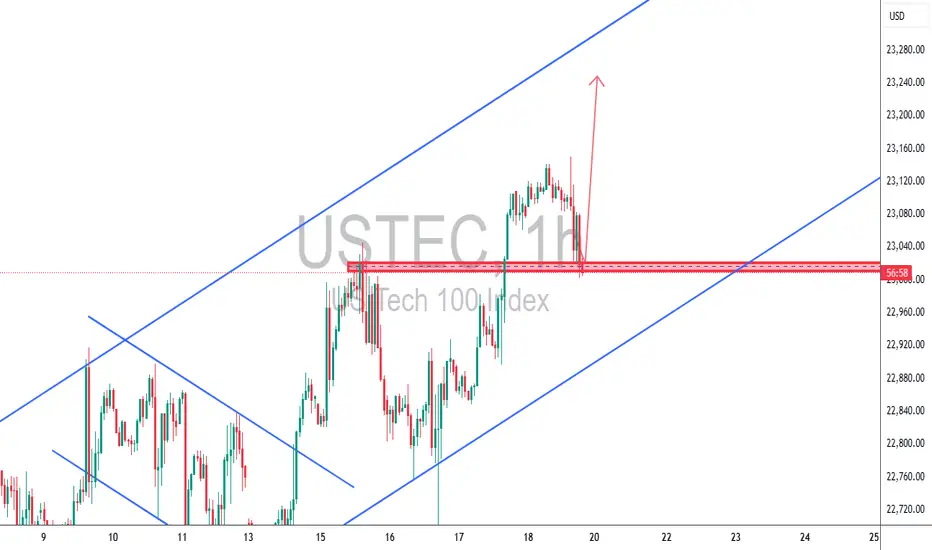
USTEC 1H – Bullish Continuation Play🔥 USTEC 1H – Bullish Continuation Play
Price pulled back into a strong demand zone and ascending channel support. We're in a clear bullish trend, and this retest offers a high-probability continuation setup.
✅ Demand zone confluence
✅ Previous resistance turned support
✅ Trendline + bullish wick rejection
✅ Clean structure with 1:3+ potential
🎯 Targeting 23,250+ while SL remains below 22,990
Strategy: TCB – Trend Phase (Pullback Entry)
Checklist Score: 100% ✅ A+ setup
Bias: Bullish – continuation expected
#USTEC #NASDAQ100 #US100 #TechnicalAnalysis #TCBStrategy #PriceAction #ForexTrading #IndicesTrading #SmartMoney #BreakoutTrading #TrendTrading #ChartAnalysis #BullishSetup #TradeIdeas #TradingView
Let me know if you want custom hashtags for XAUUSD, BTCUSD, USDCAD, or others.
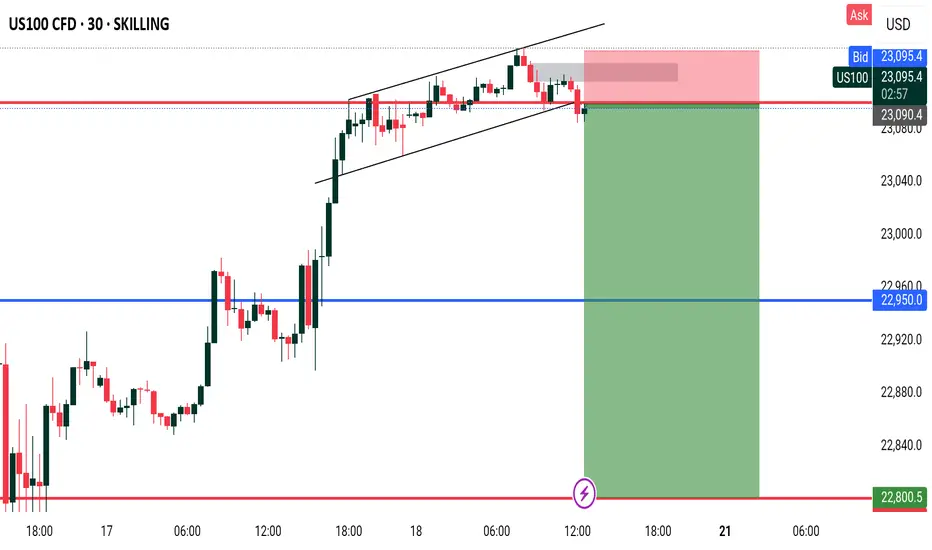
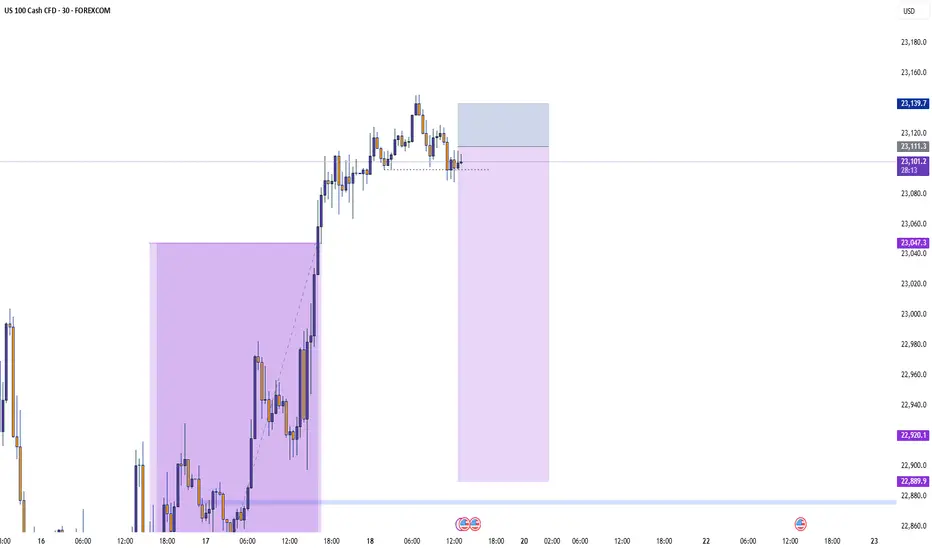
NASDAQ - Bullish BiasHTF Overview: 4H shows strong bullish intent with momentum driving price higher. Clear upside direction supported by sustained breaks in structure.
Liquidity Note: Noticed a key liquidity zone beneath current price (marked in blue). Although deeper mitigation was possible, price remained bullish.
MTF Refinement (30M): Dropped to the 30M for structural clarity and saw an earlier reaction. A bullish OB was formed and respected — now monitoring it for a potential mitigation.
LTF Execution Plan: If the 30M OB is revisited, I’ll be looking to the 1M/5M for confirmation (CHoCH or BOS) before executing long positions.
Mindset: Momentum is with the bulls — just waiting for smart money to confirm their next move.
Bless Trading!

NAS100 Nasdaq Range-Bound: What Traders Should Watch Next US100I'm currently keeping a close eye on the Nasdaq 🧠📊, which is trading within a range-bound structure 📉📈. While we’re seeing some bullish momentum on the NAS100 4-hour chart today ⏱️📈, it’s nothing particularly strong or decisive just yet. I’m waiting for a clear break 🔓 either above or below this current range before considering any trading opportunities 🎯.
In this US100 chart 🖼️, I’ve highlighted key components such as price action, market structure, the prevailing trend, and other important elements of technical analysis 🧩📐.
⚠️ Please remember: this is a market analysis and reflects my personal opinion — not a trade recommendation. Always do your own due diligence 🕵️♂️ before making any trading decisions. This is not financial advice.

NASDAQ At Good Res , Is It A Chance To Sell To Get 200 Pips ?Here is my 4H Nasdaq Chart and my opinion is the price at very interesting selling area for me , this Res Area forced the prices to go down 2 times and i think this third time will be the best one , so i`m waiting the price to go up a little to retest the res one more time and then we can enter a sell trade and targeting from 100 to 200 pips . the only reason to cancel this idea if we have a clear daily closure above my res area .

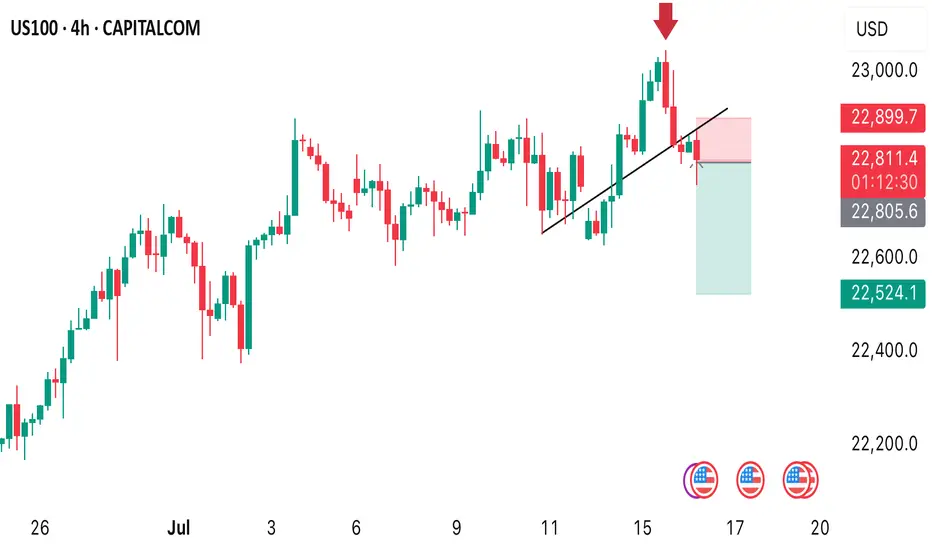
US100 SELL OPPORTUNITY A sell opportunity is envisaged as price dropped from the ALL TIME HIGH of 23000. I am shorting it with my target placed at 22524
Take advantage of this opportunity