Jamie Gun2head - Selling JPXJPYTrade Idea: Selling JPXJPY
Reasoning: Breaking trendlines, looking for an extended selloff
Entry Level: 27753
Take Profit Level: 27029
Stop Loss: 27923
Risk/Reward: 4.26:1
Disclaimer – Signal Centre. Please be reminded – you alone are responsible for your trading – both gains and losses. There is a very high degree of risk involved in trading. The technical analysis , like all indicators, strategies, columns, articles and other features accessible on/though this site is for informational purposes only and should not be construed as investment advice by you. Your use of the technical analysis , as would also your use of all mentioned indicators, strategies, columns, articles and all other features, is entirely at your own risk and it is your sole responsibility to evaluate the accuracy, completeness and usefulness (including suitability) of the information. You should assess the risk of any trade with your financial adviser and make your own independent decision(s) regarding any tradable products which may be the subject matter of the technical analysis or any of the said indicators, strategies, columns, articles and all other features.
NIKKEI225 trade ideas

Nekkie 225Hello community trading view let's take a quick look at Nikkie 225 .which it's about to sell for a short time at level 28246 and take your profit at 28054


How we made 7.26% in May with 63% win rate while markets fell Last month when markets took a beating, we were able to make 4% within 11 days of trading using trading view to help track our trades.
The month of May was a really volatile month and it took some courage to get back to where we are today. As you can see from our equity curve, we were down about 7% midway through the month and staring down a gun barrel.
teenfxtrader.wordpress.com
Here are some very important lessons that we learnt from our trading from the month of May.
1) Do not get into markets that you don't understand before testing them out thoroughly. - We started getting into indexes and especially the JPN225. What we didn't realize is that this pair moves really fast and can either wipe you out and make you lots of money. We lost 4% on the first trade but made 12% on the next. Still not sure whether we should trade this but if a good opportunity comes up why not? Just keep your positions super small.
2) Risk control is so important even if you are losing - - It is so easy to lose your marbles when you are down 7% in the first 15 days. However we need to accept that losing trades will happen and the only way you can control it is by not risking too much. Your account will ebb and flow. Some weeks are just flat. Sometimes you can have a quarter where you are totally flat and I am sure that will happen for us soon as well.
3) Winning percentages means nothing - We have always been taught in school that you are a loser if you do not get 80% and above. In trading, losing 40% of your trades is still okay as long as you lose with dignity. This month we lost 37% of our trades but yet made 7.26% by holding on to our winners.
Where do we see the market going in June 2022?
The past 2 weeks has been bullish. This is not the end of the market crash unfortunately. It is call a bear rally or a bull trap and we are likely to see the markets being pushed down to the previous lows. We still believe the target for DJIA is 26,000 and the S&P will reach 3600 within the next 3-4 months. In the meantime, we plan to take small trades to help us grow our equity as we have done in the last 45 days.
In the meantime, we are looking at a sell of JPN225 at the level marked out but it is an uptrend so we may go long until this price is reached for the sell.
Good luck!
JAPAN 225 POSSIBLE SHORTJAPAN STOCK. Clear enough for you to see the technical background. Price is respecting a very strong trendline Resistance, showing us some indication of possible down move to our 90% rule target, a rising wedge happening at a major resistance trendline. Don't be trapped by the market markers, cause thinking in probabilities price might break the trendline thereof wait for retest for breakout continuation. Apply proper Risk Management RR.

NIKKEI 1st JUNE 2022The benchmark Nikkei 225 index on the Tokyo Stock Exchange rose 587 points, or 2.19% to 27,369 points, marking its highest closing level since April 21.
Investors were temporarily relieved by the US data, as concerns that the Fed would push for aggressive monetary policy receded.
Bullish trend is limited to 27,777 rebound is possible. If breakout, the price will be higher.

Nikkei 225 on the 1D time-frameNikkei 225 may rise to 28300 - 29200
Our preference
Long positions above 26400 with targets at 28300 & 29200 in extension.
Alternative scenario
Below 26400 look for further downside with 25700 & 24700 as targets.
Comment
The RSI calls for a bounce.

NIKKEI A great opportunity to invest. 7 years recurring pattern.The Nikkei index (NI225) has been on a strong correction phase since its September Highs. Despite the early March rebound just above the 1W MA200 (orange trend-line), it was rejected on the 1W MA50 (blue trend-line) pulling the index back towards the lows.
Notice on this chart, however, that the March rebound was performed on a Higher Lows trend-line that is holding for almost 10 years, since October 2012. It was on that trend-line that Nikkei made the bottoms of June 2016, December 2018 and August 2019 and rebounded. Interestingly enough on all cases that was on or marginally around the 1W MA200. The only exception to that was the global asset crash of March 2020 due to the COVID pandemic, which of course is classified as a Black Swan event, and was the only time that the Higher Lows trend-line broke.
As a result, we have a 7 year sample of corrections that end with a bottom on the 1W MA200 and/or the Higher Lows trend-line. At the same time, when the 1W RSI makes Higher lows following an (near) test of the 30.00 oversold level, it indicates that the bottom of the correction is in and the index starts a new Bull Phase.
This indicates that the current level is a confirmed long-term buy opportunity on Nikkei.
--------------------------------------------------------------------------------------------------------
Please like, subscribe and share your ideas and charts with the community!
--------------------------------------------------------------------------------------------------------

Nikkei Attempting a Bullish Breakout of a DiamondThey may Signal that Bullishness will soon be coming to some Japanese Stocks and perhaps even the Japanese Yen if we are to get Bullish Follow-through of this Diamond Breakout

I am selling the NIKKEI (JP225) nowThis is my first trade on NIKKEI and I am scared :)
Well I just follow my rules, so I shouldn't worry.
1) Daily is down
2) H4 is down
3) Nice harmonic pattern setting up
All other indices are showing similar symptoms.
Hope it will be a good one. Stop loss is steep at 200 points but the reward is better.

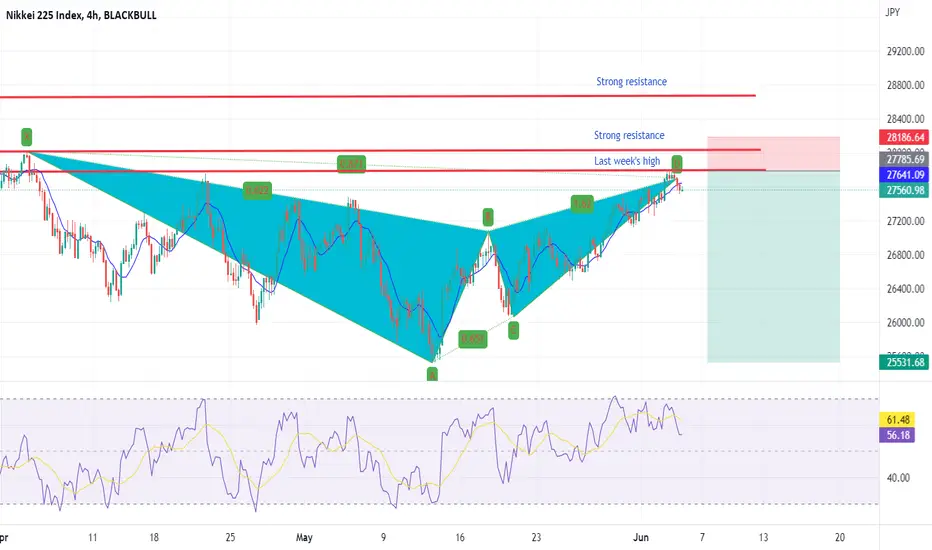
NikkeiShort team targets depends on limits calculated by harmonics and fibo golden targets,
I hope you like it…

BUYJP25 in good reward to riskhi trader's
we idea now buy jp225 , I think me this praise is good for buy
#price_action
#buy
#technical

Nikkei 225 Short entry Re-post with a clearer chart - clear bear flag setup as markets continue to show weakness and liquidations.

Index shorts - NikkeiAll markets still in sell off phase - clear bear flag setups. Heavy crypto liquidation shows retail is being washed out now.

JP225 (Nikkei 225) Index Intraday Technical Analysis:The downtrend of JP225 continued yesterday. Today JP225 showed recovery in Asian session. But this is not going to sustain in intraday. My target is entry at intraday resistance of 26300 with target of 26100.
If you like this or if you think the opposite of this or if there is any other opinion, mention it in the comments. I am open to all kind of suggestions and critics

JP225 (Nikkei 225) Index Intraday Technical Analysis:After a week full of blood in the streets. The Asian market took support from 26331. My target for intraday is support of 26300 and the goal for today is 26500.
If you like this or if you think the opposite of this or if there is any other opinion, mention it in the comments. I am open to all kind of suggestions and critics

SHORTHello Friends, We applied Triangle Breakout and fibo Entry@ 100 Stop-Loss@ 23.6 Take-Profit@ 161.8 . Like, comment if You see a better picture. HAPPY TRADING

JP225 (Nikkei 225) Index Intraday Technical Analysis:Today was a public holiday in Japan. The JP225 index which is aligned with international markets stayed sideways during the active Japanese session. Market once again took rejection from 27444. Effects of less hawkish US fed policy were seen in the Japanese market as well. My idea is that the JP225 will take rejection from 27444. My targets for intraday are entry at resistance of 27444. My goal is support of 27250 and retracement level of 27100.
If you like this or if you think the opposite of this or if there is any other opinion, mention it in the comments. I am open to all kind of suggestions and critics

a position sell for time 4hHello dear traders, we here new potion sell or short in #jp225usd
#short
#index

Great buy opportunity for nikkeiHi
In my elliott analysis, we are in second wave and the third (and very profitable wave) will be started soon.
Two target is shown in chart by fibo and resistance line.
Please like my idea if you agree with it.
Have good trade
Yours

Major Indexes are resilient but may be due to selloffThe world is focused on the US indexes which have recently broken down out of the uptrend. The question is now whether there is more downside to come which could turn into a major selloff after such a big Fed Fueled pandemic rally. I take a look at the price action and major levels of the Key Indexes.
In the US - DOW, SP500 and Nasdaq
Europe - DAX, FTSE and Eurostoxx
ASIA - ASX200, Hang Seng and Nikkei
Remember to take a look at my profile and follow for more content and analysis.

J225 short idea 15minThis is my setup for short nikkei . ithink the high for today is over , and will make new low!

Nikkei 225 - Bullish upside returning. A repeat of the historyObserving from the descending channel (green line) we could see that it is a fractural kind of pattern in the corrective wave settings. Furthermore, we have been in a larger complex triple three waves and as such, we believe that the upside is returning.
On the chart pattern front, inverted head and shoulder is seen and with the resounding morning star pattern, the Japanese is likely to see a return back to the 30,000 level Banzai!
