NFP report for Thursday July 3, the crucial figure of the weekBeware this week for stock market fundamentals, as it's a special week. Friday, July 4 is an Independence Day holiday in the United States. On July 4, 1776, the Continental Congress adopted the Declaration of Independence, a text drafted principally by Thomas Jefferson, which proclaimed that the 13 American colonies had officially separated from the United Kingdom.
For this first week of July on the stock market, this has a direct impact on the US fundamentals update. As you may know, it's the first Friday of every month that the US NFP report is updated, which is the monthly report on the US labor market. Consequently, this particular week sees the publication of the NFP report brought forward from Friday July 4 to Thursday July 3. It is therefore the stock market session on Thursday July 3 that will be the fundamental highlight of the week, with the NFP report likely to have a strong influence on the FED's monetary policy decision on Wednesday July 30.
1) The probability of the FED cutting its rate on Wednesday July 30 is just 21%
At this stage, and following last Friday's US PCE inflation update, the probability of the FED resuming the cut in the federal funds rate is just over 20%. Despite the strong pressure exerted by Donald Trump on Jerome Powell's FED, the FOMC (the FED's monetary policy committee) is in no hurry to cut rates in the face of the risk of a rebound in inflation caused by tariffs.
Last week, we offered you a fundamental analysis of the FED, which you can reread by clicking on the image below.
2) The US labor market seems to be starting to deteriorate according to the continuing weekly jobless claims
In reality, there is only one fundamental factor that could allow the FED rate to be cut at the monetary meeting on Wednesday July 30: a deterioration in the labor market with the NFP report figures on Thursday July 3. It's true that the latest updates on ongoing weekly US jobless claims show an increasingly negative dynamic which could end up feeding the US unemployment rate higher.
3) Beware, the slightest upward tick in the US unemployment rate when the NFP report is updated on Thursday July 3 could accelerate the FED's timetable for resuming the US federal funds rate
Keep in mind that the FED is pursuing two major objectives: inflation under control at around 2% and low unemployment. The FED's alert threshold is currently 4.4% of the labor force, and the consensus for the NFP report update of Thursday July 3 is 4.3% of the labor force.
CAUTION therefore: if the US unemployment rate makes 1 or 2 upward ticks this Thursday, the probability of a FED rate cut on Wednesday July 30 will rise sharply. This is the fundamental highlight of the week.
DISCLAIMER:
This content is intended for individuals who are familiar with financial markets and instruments and is for information purposes only. The presented idea (including market commentary, market data and observations) is not a work product of any research department of Swissquote or its affiliates. This material is intended to highlight market action and does not constitute investment, legal or tax advice. If you are a retail investor or lack experience in trading complex financial products, it is advisable to seek professional advice from licensed advisor before making any financial decisions.
This content is not intended to manipulate the market or encourage any specific financial behavior.
Swissquote makes no representation or warranty as to the quality, completeness, accuracy, comprehensiveness or non-infringement of such content. The views expressed are those of the consultant and are provided for educational purposes only. Any information provided relating to a product or market should not be construed as recommending an investment strategy or transaction. Past performance is not a guarantee of future results.
Swissquote and its employees and representatives shall in no event be held liable for any damages or losses arising directly or indirectly from decisions made on the basis of this content.
The use of any third-party brands or trademarks is for information only and does not imply endorsement by Swissquote, or that the trademark owner has authorised Swissquote to promote its products or services.
Swissquote is the marketing brand for the activities of Swissquote Bank Ltd (Switzerland) regulated by FINMA, Swissquote Capital Markets Limited regulated by CySEC (Cyprus), Swissquote Bank Europe SA (Luxembourg) regulated by the CSSF, Swissquote Ltd (UK) regulated by the FCA, Swissquote Financial Services (Malta) Ltd regulated by the Malta Financial Services Authority, Swissquote MEA Ltd. (UAE) regulated by the Dubai Financial Services Authority, Swissquote Pte Ltd (Singapore) regulated by the Monetary Authority of Singapore, Swissquote Asia Limited (Hong Kong) licensed by the Hong Kong Securities and Futures Commission (SFC) and Swissquote South Africa (Pty) Ltd supervised by the FSCA.
Products and services of Swissquote are only intended for those permitted to receive them under local law.
All investments carry a degree of risk. The risk of loss in trading or holding financial instruments can be substantial. The value of financial instruments, including but not limited to stocks, bonds, cryptocurrencies, and other assets, can fluctuate both upwards and downwards. There is a significant risk of financial loss when buying, selling, holding, staking, or investing in these instruments. SQBE makes no recommendations regarding any specific investment, transaction, or the use of any particular investment strategy.
CFDs are complex instruments and come with a high risk of losing money rapidly due to leverage. The vast majority of retail client accounts suffer capital losses when trading in CFDs. You should consider whether you understand how CFDs work and whether you can afford to take the high risk of losing your money.
Digital Assets are unregulated in most countries and consumer protection rules may not apply. As highly volatile speculative investments, Digital Assets are not suitable for investors without a high-risk tolerance. Make sure you understand each Digital Asset before you trade.
Cryptocurrencies are not considered legal tender in some jurisdictions and are subject to regulatory uncertainties.
The use of Internet-based systems can involve high risks, including, but not limited to, fraud, cyber-attacks, network and communication failures, as well as identity theft and phishing attacks related to crypto-assets.
UNRATE trade ideas

Trade war & NFP in focus this weekSeveral fundamental factors will have a strong impact on financial markets in this first week of June, as uncertainty surrounding the trade war remains high. However, there was some good news last Friday, with US PCE inflation continuing to move towards the Fed's target despite tariffs.
This week, two fundamental factors are under close scrutiny: US labor market figures (NFP report) and, of course, as every week, the current phase of trade diplomacy.
1) US PCE inflation is still trending towards 2% and is not rebounding despite the trade war
US inflation and employment are the two key variables for considering a resumption of the decline in the federal funds rate, with Trump receiving Powell at the White House at the end of last week. However, the Fed has reiterated its independence and the future direction of its monetary policy will continue to be guided by specific macroeconomic objectives: bringing inflation back to 2% and neutralizing any rise in unemployment.
Good news! Last Friday's update on US inflation according to the PCE price index showed that tariffs did not cause inflation to rise in April. On the contrary, the nominal inflation rate is now 2.1% and core inflation is 2.5%. Disinflation therefore seems set to continue in the US despite the tariffs, but this still needs to be confirmed.
2) The market does not expect any rate cuts before September
Despite these good PCE inflation figures for April (PCE being the Fed's preferred measure of inflation) and pressure on the Fed from the Trump administration, the market does not expect the federal funds rate to resume its downward trend before the monetary policy decision in September.
The debate remains open for the July 30 monetary policy meeting, so the upcoming updates on US employment (NFP report) and inflation will have a decisive impact.
3) The NFP report on Friday, June 6, will be crucial this week!
In this first week of June, the US labor market will be the fundamental highlight of the week. All US employment statistics will be updated, with the NFP report on Friday, June 6 being the most important. While it appears that the trade war has not yet pushed inflation up, what about the labor market? Remember that the US unemployment rate is 4.2% of the labor force and that the Fed's alert threshold is 4.4% of the labor force. If it turns out that US companies have had to lay off workers due to the economic uncertainty linked to the trade war, this could accelerate the upcoming schedule for lowering US federal funds rates.
Finally, remember that the market is hoping for a phone call between Trump and the Chinese president to finally reach a trade agreement between China and the US. This is a fundamental thread to follow every day on the stock market.
DISCLAIMER:
This content is intended for individuals who are familiar with financial markets and instruments and is for information purposes only. The presented idea (including market commentary, market data and observations) is not a work product of any research department of Swissquote or its affiliates. This material is intended to highlight market action and does not constitute investment, legal or tax advice. If you are a retail investor or lack experience in trading complex financial products, it is advisable to seek professional advice from licensed advisor before making any financial decisions.
This content is not intended to manipulate the market or encourage any specific financial behavior.
Swissquote makes no representation or warranty as to the quality, completeness, accuracy, comprehensiveness or non-infringement of such content. The views expressed are those of the consultant and are provided for educational purposes only. Any information provided relating to a product or market should not be construed as recommending an investment strategy or transaction. Past performance is not a guarantee of future results.
Swissquote and its employees and representatives shall in no event be held liable for any damages or losses arising directly or indirectly from decisions made on the basis of this content.
The use of any third-party brands or trademarks is for information only and does not imply endorsement by Swissquote, or that the trademark owner has authorised Swissquote to promote its products or services.
Swissquote is the marketing brand for the activities of Swissquote Bank Ltd (Switzerland) regulated by FINMA, Swissquote Capital Markets Limited regulated by CySEC (Cyprus), Swissquote Bank Europe SA (Luxembourg) regulated by the CSSF, Swissquote Ltd (UK) regulated by the FCA, Swissquote Financial Services (Malta) Ltd regulated by the Malta Financial Services Authority, Swissquote MEA Ltd. (UAE) regulated by the Dubai Financial Services Authority, Swissquote Pte Ltd (Singapore) regulated by the Monetary Authority of Singapore, Swissquote Asia Limited (Hong Kong) licensed by the Hong Kong Securities and Futures Commission (SFC) and Swissquote South Africa (Pty) Ltd supervised by the FSCA.
Products and services of Swissquote are only intended for those permitted to receive them under local law.
All investments carry a degree of risk. The risk of loss in trading or holding financial instruments can be substantial. The value of financial instruments, including but not limited to stocks, bonds, cryptocurrencies, and other assets, can fluctuate both upwards and downwards. There is a significant risk of financial loss when buying, selling, holding, staking, or investing in these instruments. SQBE makes no recommendations regarding any specific investment, transaction, or the use of any particular investment strategy.
CFDs are complex instruments and come with a high risk of losing money rapidly due to leverage. The vast majority of retail client accounts suffer capital losses when trading in CFDs. You should consider whether you understand how CFDs work and whether you can afford to take the high risk of losing your money.
Digital Assets are unregulated in most countries and consumer protection rules may not apply. As highly volatile speculative investments, Digital Assets are not suitable for investors without a high-risk tolerance. Make sure you understand each Digital Asset before you trade.
Cryptocurrencies are not considered legal tender in some jurisdictions and are subject to regulatory uncertainties.
The use of Internet-based systems can involve high risks, including, but not limited to, fraud, cyber-attacks, network and communication failures, as well as identity theft and phishing attacks related to crypto-assets.

If the US unemployment rate closes above 4.2%..If the US unemployment rate closes above 4.2%..
Things could get real ugly, real fast.
See 2008 crisis.

Gold & Silver miners can smell the recession.Gold & Silver miners can smell the recession.
Can you?
7 year rate of change for unemployment

Civilian Unemployment RateQuestion: What sector enjoys economic hardships?
Answer: Gold & Silver Miners.
See 7 year rate of change for unemployment

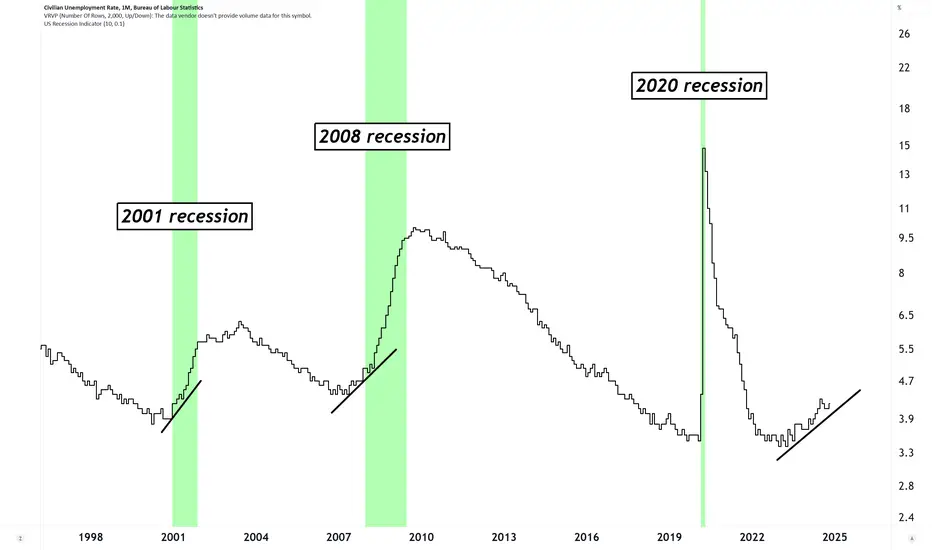
The Unemployment RateThis chart allows us to see the history of the US Unemployment Rate and when recessions have been triggered in the past.

Recession or Depression?A quick rise on unemployment, resultant of a speedy pullback on major markets, I think would be the best outcome for the US.

Unemployment Rate and RecessionsWho else noticed unemployment rate creeping up?
Tic Toc...
#recession #unemployment
2025 UNEMPLOYMENT RATE above 5.2% by Late MARCH 2025 CYCLES project a swift move up based on the pattern . DOGE and the fact a min of 15 to 25 % of federal workers have stated they will Resign and With D.O.G.E. to implement and referring the closing down part and All of several depts . should be the Cause .as well as over 890 k jobs loss in revisions .

UnemploymentThe Fed was surely spooked a while back as the rate of change remained high for up trending unemployment.
Guess what asset class initially loves up trending unemployment?
Gold & Silver miners.
#fed #fomc #ratecut #recession #gold #silver #miners

Unemployment & RecessionsWhen #unemployment starts rising like it is doing now, I have not found another time where is suddenly reverse & turns down.
Oh, yeah, #recessions are then very often seen to appear.
This opens up opportunities in sectors that track this misfortune: #gold & #silver #miners.

Gold and Silver Miners go where unemployment goes.When #gold and #silver #miners enter bull eras, massive hardship ensues for the people.
Makes me kinda sad to think about it this way...
#unemployment #economy #recession

Federal Reserve is Behind the Curve, Recession is 100% CONFIRMEDHello everyone,
The federal reserve has kept interest rates at near zero and printed the MOST money in US history back in 2020 and this has caused one of the worst inflation in 40 years. Jerome Powell decided to fight inflation by giving us the fastest rate raising campaign in history. He has kept rates too high for too long and we are now guaranteed a recession. Jerome Powell will find himself in a position to cut rates very fast due to the cracks in the job market. It is already too late we will be witnessing a huge spike in unemployment. Who knows how high this can go, back in 1929 unemployment hit 24.9%.

Welcome to the 2024 recessionOrange bars indicate recessions calculated by the NBER. Keep in mind, they waited a year to spawn in the 2008 information. Appears to have entered into the steepening phase with a MACD cross on the 2 month. Also a cross on the 21 period moving average. I believe this to be a little more accurate than the Sahm rule.

Unemployment reversal, US 500 Market DirectionUnemployment reversal, US 500 Market Direction
Historical patterns since the 90's

Unemployment, FED Rates, SPXLooks like market bottoms just before the Unemployment peak.
Market peaks just before fed starts reducing the rates.
At the current situation, we have fed fund rates high and also unemployment started to climb.
Will be looking at the unemployment going high and markets roll over and fed cuts rates.
if FED keeps the same rate for long, something in the economy will break and they have to reduce the rate and if it happens then it's already too late.
Looks like CD's and earning ~5% interest on cash is much better than risking for very limited upside in the market.

Thesis: slightly higher SP500, before crash due to unemployment12/9/2023
I - Issue:
Yesterday, the latest unemployment rate for the USA were released. The current rate stands at 3.7, reflecting a decrease of 0.2. The key question now is whether this is merely a test of support or a signal for a potential invalidation of the bottom structure.
R - Rule:
Since 1950, we observe numerous instances where the unemployment rate proves to be a reliable indicator for determining the macro trend of the stock markets.The formation of a bottom signals a peak for the S&P 500, and the initiation of an upward trend is generally considered the least favorable time to invest in stocks.
A - Application:
As per the latest data, the unemployment rate stands at 3.7. As evident from the charts, this marks a breached resistance that is now expected to serve as support. Additionally, there is a current rejection of the upper band of the Bull Market Support Band, but the price remains above it, indicating potential support in this range as well.
Furthermore, in accordance with the Phillips curve, there is a negative correlation between inflation and unemployment. This relationship suggests that the declining inflation, results in an rising unemployment.
C - Conclusion:
The lower unemployment rate currently appears to be a retest of the 3.7 level. It is highly likely that it will stay above this level, given the substantial support from the horizontal support and the Bull Market Support Band. Additionally, the Phillips curve provides an additional reason why unemployment may increase in the coming months. This suggests that, based on this scenario, the stock markets could be approaching a potential peak. Take this into consideration.

The Implications of the US Unemployment Rate - It Is Higher Now What is moving lately? The US unemployment rate has edged up.
We can see from past cycles that when unemployment numbers started breaking above their downtrend, crisis occurred.
Micro E-Mini Nasdaq Futures and Options
Ticker: MNQ
Minimum fluctuation:
0.25 index points = $0.50
Disclaimer:
• What presented here is not a recommendation, please consult your licensed broker.
• Our mission is to create lateral thinking skills for every investor and trader, knowing when to take a calculated risk with market uncertainty and a bolder risk when opportunity arises.
CME Real-time Market Data help identify trading set-ups in real-time and express my market views. If you have futures in your trading portfolio, you can check out on CME Group data plans available that suit your trading needs www.tradingview.com

Does the US have an AI problem?This chat compares the monthly unemployment rate and the job openings since 2022. Unemployment has been rising since end of 2023, basically beginning of AI, and available jobs have been down since 2022, all while the market is reaching new highs. It seems that AI brings in more revenue and reduces cost for companies. I wonder if they’ll be any regulations.

Fraud Update - Mainstream NewsLast week, on the television show "Good Morning America", they ran a segment about "the economy".
During this segment, the Disney-owned (short Disney) "news outlet", reported the unemployment rate is 3.7%.
...
......
............ the unemployment rate is currently 4%. No big deal you say? Well, I disagree. Namely because: 1. They're wrong, 2. finding out the unrate is as simple as googling "unrate".
So for some reason the supposedly professional news team at Disney-owned ABC, chose to
incorrectly report a key datapoint.
Lol. Why the fake news, ABC?

Unemployment rate set to explodeUnemployment rate is rising, and the MACD here has never given a false signal after crossover, going back to the 1950's. Crossover does appear imminent, if not a certainty

UNEMPLOYMENT % correlation with bull/bear marketsI saw a Alessio video some years ago about this correlation :
low and falling unemployment rates as an indicator of incoming crash.
Now unemployment rates are climbing from historic lows, as this is bad for the unemployed individual, it is an indicator of better times coming for soc eco

US VS EU UnemploymentUpdate on the US versus Euro Area unemployment rate.
US trending upwards, while the EU Area is quite stable.
US came in at 3.9%
While EU Area is hovering between 6.4% - 6.5%
