Recession the new buzz word after today's report?For this to occur I'm assuming its a much weaker jobs report that will excite the market that inflation is largely behind us. Then earnings disappoint and the real fun begins.
VIXCLS trade ideas

Beware the sleeping VIX volatility dragonVix measures option premium levels and is associated with large fear uncertain times. Bottoms in markets often have high vix level indicating investors desire for protection and large moves in the market.

Vix update Purple line 50sma...
If we close above this, the next resistance will be trendline at 24
Starting to get overbought on the 1 hour chart and 2 hour chart...
Which means unless this is a black swan event we may cool off at 24 until FED minutes...
Personally I don't like being short equities, especially swinging when the vix becomes overbought on 1 hour..
On the day before the last CPI pop the vix was overbought on 1hour and the next day the indexes rallied 3%. Now we're going into the FED minutes overbought.. let's see what happens.
The double bottom pattern has almost fully rounded here
2 things I'll be watching
1.Qqq 260
2. Vix 24

$VIX in middle of pattern2 From $DJI recent post
While most media & people ARE RIGHT, they tagged along @ end, too much neg
I'm contrarian, this much negativity raises flags, especially when media 24/7
Still think $VIX #VIX in between pattern gives opportunity for swings before the eventual breakout
#stocks #crypto

Looking symmetricalDefinitely not an exact science, but I am bullish on VIX. FED is supposedly going for recession. I think they are, just they try to have a "soft landing". I would even argue it's smart to have soft landing, if the leverage would unwind on a single day the financial system would stop existing as we know it.

Short term VIX signalVIX might be signaling a bullish move for the index, however that is yet to be confirmed via 4 hourly close. SPX target I'm aiming for are around 3950

Synthetic Short Against the Box with TQQQ & SPXS?I created this chart to illustrate the price action of leverage ETF in relation to VIX.
The purpose is to determine whether it's possible to create synthetic version of shorting against the box, where you never short and long the shares of the same stock.
Instead someone is only ever long the shares on TQQQ with a protective PUT, and short the shares of SPXS with a call to cover.
Then using the wheel strategy as a means to generate reliable credit.
I'm very interested to so other people's observations/thoughts...

DGSTACC: VIX PREDICTION!!!!DESCRIPTION: The chart above is an analysis of the VIX and it current pattern formation of a SYMMETRICAL TRIANGLE FORMATION .
POINTS:
1. Strong Support for VIX at 19.50 with current Demand Pocket Ceiling for FIB is at 25.
2. Move should occur by the 9th of January as price action would have to compress a lot more by then.
3. Current overall trend is a down trend that we have been seeing for VIX since early October.
SCENARIO #1: If break of Symmetrical Triangle occurs towards the downside expect a bounce at 19.50 .
SCENARIO #2: If break of Symmetrical Triangle occurs towards the upside expect resistance at 25 .
*NOTE: NO RECESSION HAS EVER ENDED WITHOUT A VIX SPIKE TO 45 AT LEAST.
TVC:VIX

Possible VIX support and shooting situations.Please note that there is a possibility of going up more than 37 lines when shooting this time.

VIX - idea is still clear2008 didn't repeat 1:1, but history tend to rhyme - and so it is doing right now.
VIX dropped lower than it should - very likely manipulation - but is holding a certain level - when I checked for any curve that could be adjusted to it - I noticed a small detail - 2021 fakeout.
2021 was the last push to the upside - the one that broke VIX trend - but now is holding to it once again. The channel is now clear and we are at the bottom of it.
Not bullish at all for stocks.
Vix likely to bounce up soon.

VIX is coiling, almost ready for its primetimeVIX is in triangle and needs above 24.9 to confirm the new bullish explosive move.
I do believe this will do 3x or so before the market makes its final capitulation low

Which H & S pattern breaks down first?In theory, you could make the case that AAPL and the VIX both have long term H&S pattern tops which are nearing their respective breaking (validation) points. Whichever one breaks will invalidate the pattern of the other. Which breaks first?

Vix... Fireworks 2nd week of JAN Huge double forming inside this pennant .. I also notice some large Put orders coming in on the spy between 340-350 Exp late Jan..

Vix pullbackLooking for a pullback to 20.50 before next week.. bumped and rejected off trendline again today.

S&P500 vs VIXWhen this pattern holds:
- VIX higher after making a higher low
- S&P500 lower, this happens after the higher low on VIX

VIX is on strong supportVIX seems really bullish as it retests support and broken curve trend - Expecting a bounce up - which makes me bearish for stocks and risk-on assets.

VIX is getting close to its support level, againAs mentioned before, I dont expect VIX to move till mid Jan, than i expect it to explode!
Im still long with 35 Apr calls and will be adding those to max size mid Jan as I expect the price to 3x from around here

VIX Long From Support! Buy!
Hello,Traders!
VIX is again about to retest
The horizontal support level
So I think that we might see
A local bullish correction
Buy!
Like, comment and subscribe to boost your trading!
See other ideas below too!

Warning VIX model is now set up to SOAR My work posted a few days back call for a drop to below 20 .Today we saw this and I was 85 % plus net long goint into this morning in trow spy qqq smh aapl and calls I HAVE SOLD EVERYTHING net gain 3.5 to 4.6 % I am now back to 100 % cash the net gain for 2022 is now back above 64.2 % . I stated this rally would be very strong into jan 3/10 2023 see 1973 chart dec 15 . The issue is now that the VIX did not get up to mid 24 /27 as I had hoped . So what is next well we had 4 days below the bb bands which on odds rallies min back into it and we saw that today . I do NOT like the pattern in the vix see the arrows and this formation the last 4/5 times the VIX SOARED > I am flat and I will not short . I am NOT SURE with this setup I must PROTECT GAINS as everyone else takes losses of min 20 % see forecast dec 2021 model min drop 20% for 2022 well 2023 I think we will see another 16.8 to 21 % drop I am working on the cycles as well as the SPIRALS . best of trades WAVETIMER

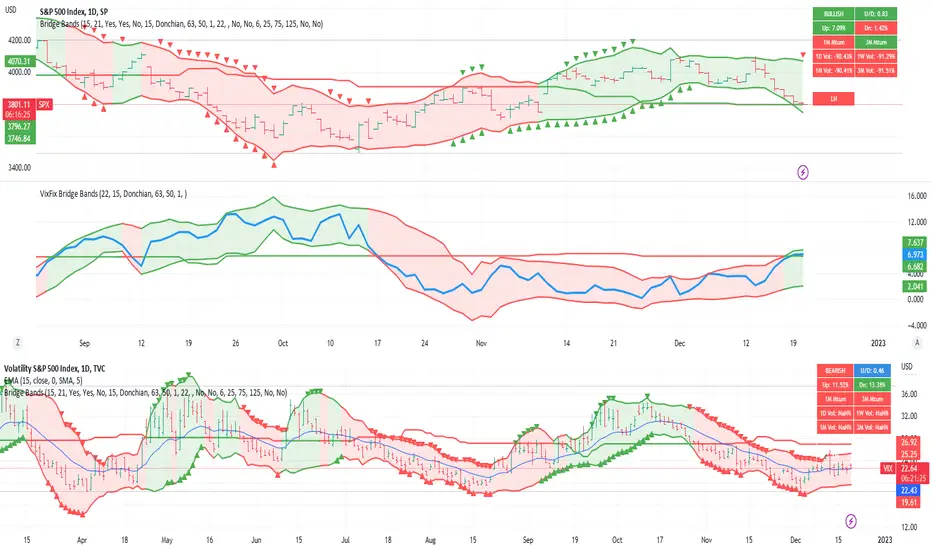
SPX with VIF FIX Bridge Bands to show volatility levels.SPX with VIF FIX Bridge Bands to indicate volatility levels.
DGSTACC: VIX MACRO ANALYSIS / CONFIRMED CHANNELS & RESISTANCEIn the chart above I have provided the following:
1. Channel confirmation on the daily timeframe.
2. Current downtrend channel in VIX that appears to be coming to an end that should definitely expire by January 24th.
3. Resistance marker at 25 from previous tests can indicate strong support for SPY in return as it can force VIX to stay in demand zone.

VIX BULL$VIX is creating a Bullish 1-2-3 Pattern at its previous market structure bottom (Support marked by the grey box). Price is currently consolidating at support and what historic price action tells us is that price usually has a period of consolidation known as a pullback or "Retracement" before it continues in its overall direction. I have price returning to an older higher-low Level @25.50 and beyond.

LONGThe fear indicator rebounded from support 22.50 , which forms a demand area - currently the candles are at a resistance close to 25 - the breach and constancy opens the door for an ascension to the target at 27
