Global M2 Money SupplyWith more money than ever before in circulation available. Asset prices should go up..
Do you agree or disagree?
WM2NS trade ideas

Bitcoin has been dietingWhen is Bitcoin going to gobble up all the money central banks have been printing? Look at the pie getting bigger! C'mon BTC, doing your thing beeetch. HAHA. Look at this meme!
pbs.twimg.com

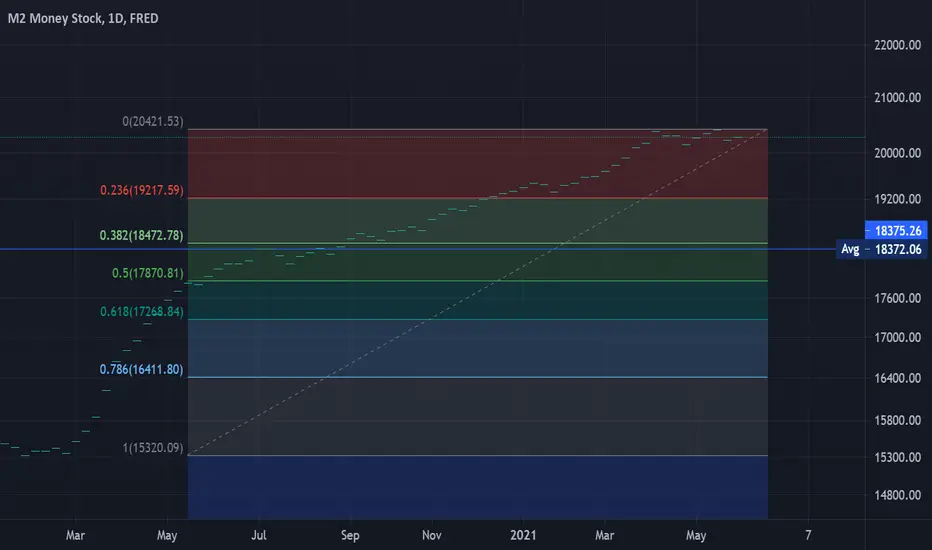
A look at M2 Money Stock Out of curiosity I took a look M2 to see the trends over the years and how it compares to COVID and the last few years. I don't have any great revelations to share about what to do, but I thought the chart was interesting. I also did some research and used ChatGPT to help me create a summary about M2. Please note that I cannot guarantee the following text is perfectly accurate, I am not a financial expert or advisor, but it is an interesting overview. Enjoy.
1) Introduction:
Money Stock Measure 2, or M2, is a comprehensive measure of the money supply that includes various types of financial assets held by the public. It encompasses M1 — which consists of the most liquid forms of money like cash and checking deposits — and adds less liquid forms such as savings deposits, time deposits under $100,000, and retail money market mutual funds. This broader measure provides a more complete picture of the available money within an economy than M1 alone.
2) Why M2 Matters to the Economy and the Stock Market:
Monetary Policy Indicator: M2 growth rates can indicate the looseness or tightness of the Federal Reserve's monetary policy. Rapid growth in M2 may suggest a looser policy with potential implications for lower interest rates, while slower growth could indicate a tightening policy stance.
Economic Health Predictor: Fluctuations in M2 can signal upcoming changes in economic activity. An expanding M2 typically suggests that more money is flowing into the economy, potentially boosting consumer spending and overall economic growth. However, if this expansion leads to inflation without an accompanying increase in real output, it could be detrimental.
Interest Rate Influence: Since M2 impacts interest rates, it indirectly affects the stock market. Lower interest rates from an increased M2 can reduce borrowing costs and stimulate both capital expenditures and consumer spending, which generally supports higher stock prices.
Inflation Expectations: Inflation can erode the purchasing power of money. An inflating M2 can lead investors to adjust their expectations, impacting bond yields and stock valuations.
3) As an investor, monitoring M2 can enhance decision-making in several ways:
Growth Trends: Observing whether M2 is expanding or contracting can provide clues about future economic conditions and monetary policy directions, helping investors anticipate market movements.
Asset Allocation: During periods of M2 expansion (indicative of lower interest rates), investors might favor stocks, particularly in sectors like consumer discretionary that benefit from increased consumer spending. Conversely, a slowdown in M2 growth could be a signal to move towards safer assets like short-term bonds, which are less sensitive to interest rate rises.
Sector Impacts: Different sectors react differently to changes in M2. For example, financials might benefit from higher interest rates, while sectors sensitive to consumer spending could gain from an expansionary M2 environment.
Inflation Hedge: Rapid increases in M2 that might lead to inflation suggest that investors should consider assets that typically perform well during inflationary periods, such as commodities or real estate.
Global Considerations: For those invested internationally, understanding how M2 changes affect global markets and capital flows is crucial, particularly in how developed economies' liquidity influences emerging markets.
4) Conclusion:
M2 is a critical economic indicator that offers valuable insights into future monetary policies, economic health, and market directions. It is not a perfect metric on its own, but by integrating M2 data into broader market analyses and considering its implications on different sectors and asset classes, investors can make more informed decisions, optimizing their portfolios to better navigate the complexities of financial markets.

Are #Stocks expensive? No measured against M2 money supplyThe 2000 Top was still the "real" peak of the US stock market
Built obviously on the expectation that the internet would change the world and teh global economy.
This highlights how the market foresees the future and how market participants are forward looking.
The #DownJones index is still 50% down form that peak
on this chart you can multiple chart patterns tat have played out previously
HVF's, double top, head & shoulder tops, and inv H&S bottoms
currently in a 22 year continuation inv head and shoulders which is still in progress
my stance is Top in April/May 24 .... downdraft into the election and a run up for 2/3 years into the Giga Uber TOP

The TREND is your FRIEND 21 $Trillion incoming. #Fiat #dxyM2 is a classification of money supply. It includes M1 – which is comprised of cash outside of the private banking system plus current account deposits – while also including capital in savings accounts, money market accounts and retail mutual funds, and time deposits of under $100,000.
Governments are not shying away from negative rates and printing money.
This is akin to a Financially Transmitted Disease.
As a result of this incredible money printing in the United States, the U.S. dollar is under siege.
Commercial traders are net short nearly 26 thousand contracts
the most since 2019.
This means that investors are betting against the US Dollars at levels not seen in years.

Gov't Money printer Turned back on.Macro Commentary
Cash will continue to be forced into assets either through investing or during the transaction/exchange of commerce. The printing won't end Until there's real change in fiscal policy and the new normal may be at the same adjusted rate during the 2008 collapse.
People who do not trade their fiat for assets or income generating sources will get left behind to be stuck paying higher prices in the future. Normally this is the difference between the people who do invest and the people who don't.
However we are getting to a scary point where this cycle may leave so many people so far behind that most investments and assets may become out of reach crushing the middle and lower class even further..
PS: Buy BTC

W2 Monetary retraction model FED is rapidly pulling cash out of the system
leading up too the debt ceiling default date on the 5th of June
This big pull should of happend way earlier
You see the covid massive melt up and now we are pulling cash out
I doubt we hit COVID lows
Just want to post my model at mid price and see how much cash we pull out before
We inventively print again

$WM2NS -And Always Remember ...
And Always Remember NOT TO :
- LIVE for it
- DIE for it
- Turn yourself in to a SLAVE for it
- Sell the most precious Asset owned, Your TIME
- Fall in LOVE with it
- Get BLINDED by it
- Be GREEDY for it
- Do others WRONG to own it
- Betray OTHERS TRUST to own it
- Put others DOWN if in abundance you own it
- FORGET your LOVED ONES for it
You and I BOTH Got to be CAREFUL,
this is a mutual reminder to my self and you.
I love you !
Don't be Miserable !
DO NOT ALLOW THE EVIL of the Money TRAP You
Dearly take all these advices and hold them close in to your heart .
Have seen people act upon all upmentioned criterieas !
People who let THE EVIL OF MONEY take the best of them.
Don't be like them people ,
I LOVE YOU
NEVER FORGET :
THEIR MONOPOLY OF MONEY IT'S A BIG FACADE !
IT'S A VERY WELL DESIGNED GAME TO KEEP US IN CHECK , TRAPPED AND MISERABLE
TO ENSLAVE US AND MAKE OUR LIFES GO IN VAIN IN ORDER TO OWN IT IN ABUNDANCE OF WHAT THEY SIMPLY PRINT CREATING INFLATION HURTING US

M2SL | Mo Money Mo Problems!Oh boy, many of them problems...
Sometimes there are cycles, some cycles are shorter than others.
In chart analysis, we are familiar when we analyze trends. Either short term or long term.
The economy does not function only in trends. There are cycles. The most common / important of cycles is the yearly one.
Unfortunately, cyclic patterns may prove tricky to analyze. But they are very important.
Since I haven't taken the time to create TradingView indicators that calculate cycles, I will instead use a spreadsheet.
For the following charts, I basically take all historical data of a cyclic chart and export that data. For every week or month, I calculate the average distance from the mean. With that, I try to calculate the "expected distance" from the mean, for each time of the year. Natural Gas prices one might say, are lower during the summer months. So an unusually high price in summer may become explosive during the winter.
Today's main subject will be money supply. Since the January's M2SL data hasn't yet updated, I will try to guess how much money supply we can expect the following months. There is a cousin to the M2SL index which is updated weekly, and it is WM2NS. This index however as you can see on the chart above fluctuates from M2SL throughout the year. So, the regular WM2NS price should be adjusted based on it's cycle against M2SL.
This curve shows the expected yearly fluctuation of the ratio, compared to the mean,
Specific care has to be taken when we calculate the "fundamental cycle duration". Some cycles last 2 months, 3 months, or 6 months. The fundamental cycle of the economy is 3 months which repeats 4 times during the year. While this may prove irrelevant, It is incredibly important in the "cycle spectrum" creation.
If we consider a 1M duration of the fundamental cycle, the chart isn't as representative as the 2M one.
The Diesel / Gasoline cycle is incredible. This comes to prove that these two are highly correlated.
With the same method we can compare gasoline price with crude oil price.
For fuel prices, it seems that the end of the year can serve as a good baseline for the outcome of the next year. Absolute and relative are at their minimum in this time of year.
Similar charts can be drawn for DJI. While more chaotic (wider error lines), weeks 10 and 44 (March and October-November) appear as the weakest periods of the year.
So what M2SL price can we expect in the following days? I am an impatient man, I cannot wait for the results!!!
After a substantial drop in money supply, one might fear that further downside is to follow.
There are charts that calm such fears. Price has never touched the Quadratic Kernel indicator (a form of historic moving-average), and it may never touch it.
When RRPONTTLD increases, money supply decreases (I am oversimplifying because I don't know the exact specifics).
Bullish stochastics may signal more upside for money supply.
Finally, I will analyze the protagonist chart:
Suddenly, the 1.2% increaase doesn't sound that extraordinary...
Sometimes, a simplistic analysis like this one above, may prove correct like this one below:
Final thought:
With inflation higher than expected and money supply about to increase yet again, how high of an inflation can we expect?
With commodities bull-flagging against money supply itself, and Bitcoin bull-flagging against the Tech-Bubble, things can get pretty bad for equities...
Tread lightly, for this is hallowed ground.
-Father Grigori
PS. I have analyzed several cycles for different kinds of commodities. If you are interested ask me so as to post them.

Next 24 Months M2 graphing doodleJust a doodle on the M2
Does the Debt Machine keep spinning upward stay tuned
You won't wanna miss What happens next

M2SL | Duplex Megaprinter 8000 ™Back in the 80s, we thought that by 2020 we would have an automated oven and flying cars. All we got is a money printer, and we liked it. We played with it a lot. And this year for Christmas, who wouldn't like some more printer ammo?
Since high inflation cannot ensure social stability, we have only one option. Lower inflation. That is the motto of the FED, the hope of every investor, a lower inflation figure. The consumer is overwhelmed from the increasing cost to survive . The inflation war is nowhere near it's end. We have gone from commodity inflation to services inflation, to the everything inflation. We haven't managed to stop it. What if there was another way?
Actually there is another way. If you break the oath of "never read the news" and actually read the news, you will realize that the average consumer is getting the help they need from grants. Governments throughout the world have found the way for social stability. They simply buy us off.
Record high electricity bill? No problem, here is a grant, the government is paying a percentage of the bill as a help.
Expensive fuel? Here are 100€ in fuel discount to go to work.
It is like the best Christmas ever. Businesses get to enjoy 100% of the earnings they want, consumers consume, and governments have social and financial stability. They just have to keep the game going, keep the printer full of ink. Everyone is happy. One could say that this perfect scenario we are in cannot fail. And even if it breaks, we keep the printer rolling.
Sometime in the not-so-distant-future of course, something could break. We have just moved the problem from the consumer to the investor/corporation/government. We have gained some time. It is just incredibly difficult for me to understand what could break if this game goes on and who will take the dive. At what point will this printer stop helping us?
Right now it helps many. Also go out and talk with people, almost nobody talks about inflation as a problem that could completely destabilize the global economy. They just care about the immediate issue, that everything is expensive.
We are humans, and not a very wise kind. We are an infant species (like Dr. Breen said). Even now that we realize what we have created, and try to solve it, we do it in a fashion that will ultimately turn against us. We buy out everyone and everything, we have made humans more dependent. With all that technology around us, I realize that we are incredibly fragile. We haven't managed to be empowered from technology, we are swallowed in it. And we hate the word Plan B, imagine how trapped we are in when we don't cover our bases.
We buy out our problems because we search for the easy way out. That's the reason we made the printer in the first place. We needed to solve one issue, ignoring the future repercussions.
After all that epilogue, I will now add the prologue. This idea is upside down, like everything around us these days.
On the main chart, we see that we have found support on the weekly ribbon.
The 1M (and 2M) chart suggests that we are heavily supported from below.
Do note that dropping oscillator on money supply does not mean significant price drop. Since money supply increases exponentially, a bearish oscillator suggests that we are on the upper side of the trend.
This chart shows us the Reverse Repurchase Aggreements.
We have RSI divergence, and stochastics dont help the situation. RRPONTTLD dropping is signaling QE.
As SPY_Master stated in this idea, this chart shows us the effort the FED does to fight inflation.
Yields show a similar picture. We are under significant resistance from the 200EMA in the 2M chart. Stochastics print a bearish signal.
CURRCIR/M2SL may be printing a bull flag.
What will be the effect if currency-in-circulation increases compared to money supply? How will prices and inflation react? We have already had significant increase in the past year in the ratio.
US money supply is showing signs of increasing, or at least stagnating. This chart comparing US and EU is alarming...
Tread lightly, for this is hallowed ground.
-Father Grigori

Did Biden cause inflation through QE?Many people think that Biden engaged in the QE that is leading to inflation.
This is simply false.

M2 vs. M2v (or Money Supply by Money Velocity) This is a pretty bleak chart illustrating how printing more bad money is not the solution to a broken monetary system. The FRED:M2 can be seen gradually increasing at around a 30 or so degree slope until about 2011 onward where it becomes steeper... then at the beginning of the pandemic -- it turns parabolic. During the same period you can see the FRED:M2V which is a measure of how much penetration each dollar is getting (in other words, how many different hands does it touch on its way through the economy. More velocity means each dollar goes farther as it relates to the health of the economy.
So what in the world is happening now? Well a massive influx of new dollars added to the money supply aren't moving past wall street. Most of this money is just bouncing between super wealthy and well-connected insiders, being used by corporations to buy back shares, or simply just sitting in a literal or electronic vault, where it never reaches the actual economy.
This is a dangerous situation that can get out of hand quickly, culminating (in the worst case) into a widespread loss of faith in the money supply and almost overnight devaluation of the currency. This has happened with ever other paper currency in history, which would be an excellent place to begin research if you are interested in knowing more about what is happening to our currency.
My only advice is to be aware that the security you feel with a wallet full of cash is actually a luxury only afforded to global hegemonic powers; one which is always ephemeral even though many may struggle to remember a time when that seemed possible.

Macro Bubble Tracker v2.0Updated to include marketcap weighted average, added GOLD, remove Russel 2000
Opinion unchanged, grab cash

The FED Roach InfestationMoney supply expansion is like roaches. It goes everywhere you don't want, and nobody can control it.
Plotted here is the money supply to futures ratio of soy, wheat, corn, and sugar. We have the potential to see a massive increase in food speculation, simply because it's not risky. When equities burst, the money goes anywhere it can. So we should expect a breakout here unless the fake money kicks back into gear.

LAST BLOWOFF the coming END of buying power Since 1982 the FED has been on full throttle with the M2 money supply . Based on Debt based system anything though of being an Asset has been inflated to which I see a major turn in our Society in this year T he year of the last bubble . I look for a major CRASH into a panic into oct 2022 basis . I do not see anything that can stop what is coming . U.S debt to GDP 127 % and As of Jan 1 2020 everyones tax due is about to soar ! based on gross income . Time to prepare is at an end

Mad money printing from central banks, how will it affect you?Just a quick chart to show all the new money thats being printed by central banks
we can see how the stock market is being kept alive by all this extra wealth being pushed into it, keeping it bullish, the only downside is obvious, INFLATION, massive amounts of very dangerous and harmful inflation!
Highlighted the 2008 housing market short and also the most recent injection in March of 2021 for all this COVID B; and there is more to come now that President Biden has signed another package to print even more...
Its a house of cards and can already see it falling (not the money supply but the system) - are we being pushed into crypto? how does this effect the crypto markets too?
I'll do another chart showing the price of bitcoin compared to the extra money and show why we still have much more upside on Bitcoin and the crypto market, will BTC go parabolic like the money supply??? We shall soon see!!!
Trade well guys and gals, hold on tight if your just in fiat cause its gunna get very rocky ride down the next set of rapids - the only diversity you need in your life, is in your portfolio!!

Maybe inflation is transitory?Money printing in real terms is admittedly at the top of the historical range of this data set but its not beyond what we have seen.
Maybe inflation is transitory? Maybe it's not. It is clear that a vast majority of the additional money printing causes asset inflation otherwise this chart would look a lot different. i.e. if gold didn't have a significant move up then this chart would have broken out to a new ATH a long time ago.
Yes these charts are Raoul Pal inspired so nothing original is going on here but I find the idea of making gold the denominator or unit of account, to be a fascinating lens to view things.

M2 Money Supply correlation to SPYLong term investment is a sure way to mitigate inflation. Now I realized putting into equities is better than FD for 2 years and above.

M2 Money Supply in TV!Quick update:
We can now see the M2 Money supply in Trading View. Just type 'FRED:' as the search term as the symbol.
There was a TV notice about this, but I wanted to store it here too, because it's really helpful :)
Here's the notice:
www.tradingview.com
Also see these other instruments that are available now too via FRED:
tvblog-static.tradingview.com

Liquidity - Macro PerspectivveIn additional to Wells Fargo - more than one dozen additional Banks have
reduced Lines of Credit (LOCs) - the prior contraction in Personal Credit
occurred two weeks before the previous Retracement South.
We anticipate the Net Effect will be Negative with an abrupt reduction in
M2 into the end of August.
Black Swan - Transitory InflationIdea for Macro:
- I present to you a counterargument for the media blaring inflation narrative.
- Speculate that the interest rate hikes (Jackson Hole, etc.) are just red herrings. In fact rates may go negative.
- The real shocker is that everybody is positioned for inflation when inflation is at its peak and is indeed transitory. The reflation trade was debt driven and is supported by nothing but hot air.
“Inflation - A continuing rise in the general price level usually attributed to an increase in the volume of money and credit relative to available goods and services” - Merriam-Webster
Actually global credit impulse is rolling off.
- There are 3 types of inflation that are relevant: Monetary, Consumer Price, Asset. (Lyn Alden, www.lynalden.com)
Monetary Inflation:
"In highly indebted economies, additional debt triggers the law of diminishing returns. This fact is confirmed when the marginal revenue product of debt (MRP) falls, where MRP is the amount of GDP created by an additional dollar of debt. In microeconomics, when debt is already at extreme levels, a further increase in debt leads to an increase in the risk premium on which a borrower will default suggesting that the bank or other lender will not be repaid. As the risk premium rises, banks are often unable to price this additional cost through to their private sector borrowers thus the loan to deposit ratio of the banks falls. Combining both the falling MRP with a declining loan to deposit (LD) ratio, results in a reduction in the velocity of money. In terms of the impact on monetary activities, a drop in the LD ratio means that more of bank deposits are being directed to the purchase of Federal, Agency and state and local securities in lieu of private sector loans. The macroeconomic result is that funds are shifted to sectors that are the least productive engines of economic growth and away from the high multiplier ones." - Too Much Debt, Hoisington Investment Management Co.
- Yes, you have M2 skyrocketing, but compare it with Debt and adjust for inflation. Wow, It did nothing to debt levels. GDP adjusted for inflation barely recovered:
- M2 doesn't exist in a vacuum, but needs to be balanced for deflationary forces. Debt is winning.
- Yes, you have consumer price inflation and asset price inflation, but these are largely driven by speculative bubbles. They are not driven by fundamental factors nor underlying conditions. They will regress to the mean by Reflexivity.
- Yes, there are supply chain issues due to COVID + political tensions, but how long will it last? Are the political tensions even necessary? What happened to lumber even with supply chain issues?
- What is even the reason for continued asset purchases by CBs?
IMO, asset purchase tapering is done to engineer a crash in the speculative asset bubbles, so that more extreme monetary policies can be enacted to try to stop the tidal wave of debt.
Once the speculative asset bubble collapses, consumer price inflation will be controlled as well. In fact there will be a dollar shortage, as each dollar is leveraged 50x+ vs. debt.
- CBs don't care about speculative asset inflation okay? Not a big deal. Bubbles even pop by themselves. Price of Big Mac and used car goes up a little bit, boohoo.
- Evidence to support my thesis is falling inflation expectations. Inflation expectations are what drives asset prices up. If inflation is expected to decrease, then the prices of assets are expected to decrease. Why would anyone hold an asset expected to depreciate in price?
Signals of falling inflation expectations:
Inflationary yields:
Inflationary currency pairs:
FRED inflation expectation rate:
fred.stlouisfed.org
Gold - you might see something crazy happen here. This can be the end of a distribution pattern:
Inflationary Commodities:
- The stock market is one of the last markets to receive liquidity trickling down from the source. Currencies, bonds, commodities lead them and stocks should not be used as an indicator for future inflation expectations over them.
- Right now, the world is positioned for inflation and are looking for interest rate hikes as the signal, but that won't be catalyst.
- Inflation and liquidity flows have been cut off at the source, and now we are at the cliff of the debt driven sugar rush. There must be great suffering in order to justify more extreme monetary policies. Then and only then will you have sticky inflation in a stagflationary environment.
"Inflation is transitory" - Jerome Powell
GLHF
- DPT
P.S. Disclaimer - I am relentlessly selling risk assets, long volatility and bonds.

Market inflection PointM2 Money supply / DJI
Nearing an area of support a fall through of the support line and we could see selling exhaustion that would cause the DJI to melt up.
Where a boost in buying would see the DJI melt down. What could cause M2 to either be peddle to the medal or taking the foot off the gas.?
Inflation, lets see how the fed can handle inflation. We have already had statements from non voting fed member one even saying " America can not afford another housing boom bust cycle." Well big boy you got the printer fire that thing up. New dollars hit the market rates go lower and boom, they got the housing market pumping all time highs. Conversely we could see the markets correct by the fed either pull back on the money printing and pausing we could see the M2/DJI rise.
