FTMBTC Elliot Wave CorrectionWell you see Double Top in this coin and now Correction i have drawn in the chart if this follows than good i'm also want to say that this can not come to C wave because of Volume i am seeing right now and it also pumped While we have death Cross in chart (check chart and add 50 200 MA)
when there is news it Doesn't Matter if bearish Scenario.
so let's take chance when this coin make a good support and create a support zone and hold your coin after B wave it can go higher not sure but yes it can
FTMBTC trade ideas


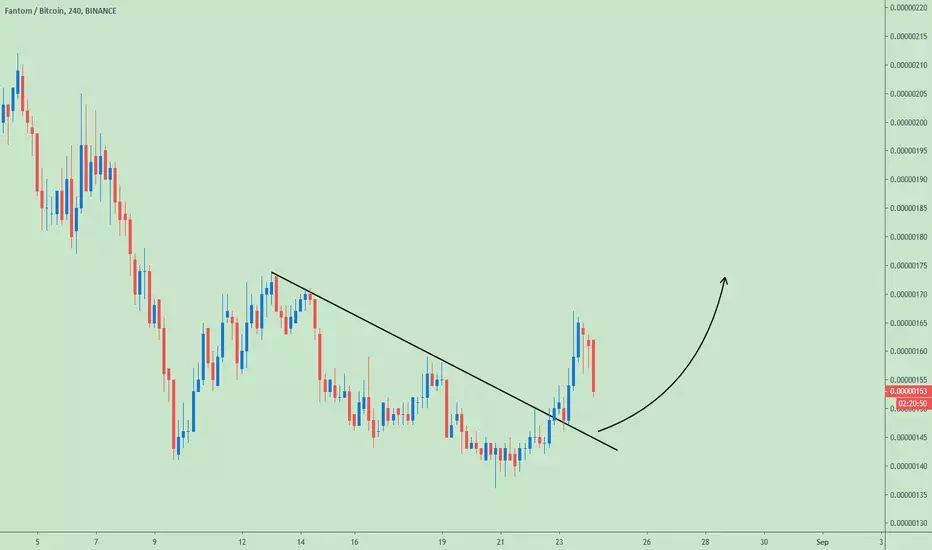
$FTM, looking strong with a nice breakout from accumlation range$FTM
Big picture, looking strong with a nice breakout from accumlation range
Zooming in:
UCTS Buy signal active on almost every TF
EMA200 (red) acting as resistance
A retest of ~190sats is possible prior reaching new highs (if happens, great entry)
As targets: ~230/270
Buying now could be a little overkill(FOMO), waiting for a retest could be a safer bet...
#FTM


Fantom Turns Green (Next Target | Chart Analysis | +55%)Fantom (FTMBTC) started the day with a full green candle aiming for 0.00000186 and higher. If 0.00000186 can be broken the next target will be 0.00000200, over 13% of profits from the current price.
The last target is the 29-July peak which is sitting at 0.00000277 BTC for a total of 55%+ of profits.
We are looking at a bullish RSI and a bullish MACD crossover.
The day is just starting, so much more growth can happen.
Conditions for change : If FTMBTC retraces and moves below EMA10 (0.00000158), the above signals are invalidated and a new analysis is needed.
Thanks a lot for reading.
Namaste.

FTM/BTC (4H)Currently we are trying to draw a double bottom. No safe entry yet - have to see if the price will be able to break a neckline. Zones of interest and targets are on the chart
DISCLAIMER:
This is just my opinion and view of the market. Please keep this in mind and consider in your trades.
Hit "Like" if you like my analysis. That would help me to understand if you really liked it :-) !
Trading ideas are not trading recommendations - this is just my point of view. You can agree or disagree with it.
Your likes and comments really help me. So I thank everyone in advance who really does it!
Good luck everyone!


FTM Revisited (FTMBTC) Quick revisit to FTMBTC, a trade closed for decent gains earlier this month. It's now completely retraced and approaching all-time lows.
Not looking to enter yet until market improves, just watching to see how we react as we approach these critical levels and try to break this downtrend.
BTC Tips: 3KKD7YKR7x9c4AZJJ56XJA8F3hp7hWSpTX

FTMBTC Falling WedgeFTMBTC Form LL of Falling Wedge, if market won't fall, the breakout is possible.
Let's see

Looks like perfect consolidation zone for FTMBTCFTM shows perfect consolidation zone, that's is nice setup for change of trend
Let's see what chart will show in nearest time.
TP 318 sat
SL 152 sat


FTM - Elliott wave Analysis from 31/7/19 - Learner's moduleThis post is for those who wish to improve their Elliott wave analysis. Interested traders can comment their wave counts. Wave counts will be updated based on the discussion in the comments. Right or wrong, feel free to comment your wave counts. This post is only meant to learn. My wave counts can be right or wrong, as I am also a learner.
Here are some resources for learning Elliott wave theory -
Books :
Five waves to financial freedom by Ramki N. Ramakrishnan(I am currently reading this)
Elliott wave principle by A.J.Frost and Robert Prechter
Mastering Elliott wave Principle by Constance Brown
Online :
elliottwave-forecast.com
school.stockcharts.com
school.stockcharts.com
school.stockcharts.com
bullwaves.org
www.thebalance.com
Targets for wave (3) top based on fib extensions of wave (1). The targets in the below chart are drawn using Trend based fib extension tool. Targets - 100%, 123.6%, 161.8%.
Coming to wave (3), sub wave 1 and 2 are done. Sub wave 3 has started.
Sub wave 2 of wave (3)
Sub wave 3 of wave (3). Pull backs may never come.

FTMBTC - prepairing for bullrunFantom is currently in accumalting phase. In the simulation on the righ site down on the chart is described how the bottom works with triangle. We can see strong downtrend, after that is formed symetrical triangle and then is usualy breakout which can start bullrun. So you can execute a trade now, place stoploss below the support trendline of triangle and wait for the targets.
.
First target can be the red box, 2nd around 340 sats. and last around 392 sats.
.
You can see a great long-term opportunity too. So for a long-term trade you can buy now, place stoploss below the last swing low of the triangle and wait for 2nd and 3rd target.


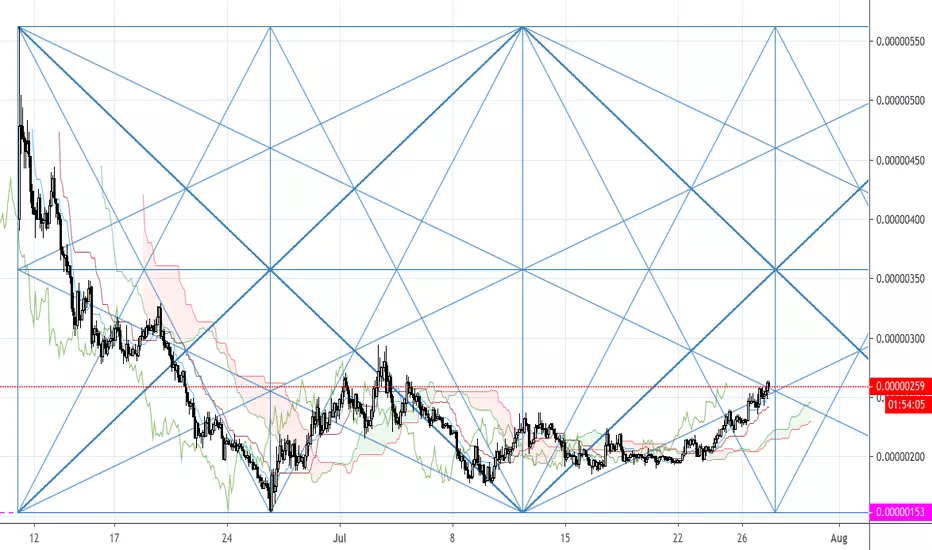
Massive ascending triangle formingHave spotted which appears to be a massive ascending triangle forming however I will not trade this until it breaks out and closes above the resistance line on the daily, keep an eye on this gl.

FTM (Fantom) Symmetrical Triangle Breakout...!!FTM (Fantom)
- Symmetrical Triangle Breakout Done.
- Wait For Retest For Entry.
- Looks Bullish In 8 hrs TF.
- 280 Sats is Major Resistance .
- It's Solid Project For Midterm As Well.
DISCLAIMER:
I'm not a financial advisor and no information provide is intended as financial advice. It is our opinion and nothing more. Trading and investing in Cryptocurrencies is extremely high risk. Ensure that you conduct your own due diligence before deciding to invest in any asset. You are responsible for all actions you take as a result of reading/viewing this page.
Hit Like On Idea For Support & Follow Me For More Interesting Ideas.
Thanks

$FTM, Symmetrical triangle trying to break to the upside.$FTM / $BTC
Symmetrical triangle trying to break to the upside.
As inmediate target, 230sats sounds logic, if crossed (volume needed), aiming for 270sats.
UCTS Buy signal active on the 8H chart.
Both MACD & RSI are bullish
Remember to use a tight Stop loss just in case.
#FTM
