FTMBTCHello Crypto Lovers,
Mars Signals team wishes you high profits.
We are in the 4-hour time frame. There is the yellow line which is our weekly support. R1 was previously the support area which is now broken and the price is now moving at the S1 area. We expect the price to be supported at the weekly support line. You can buy it here for the R1 resistance and also put in the Stop Loss. If the yellow line is broken, the S2 area would be the next support for the price. The price has hit the weekly support and was supported. We expect the price to follow the previous example and move up.
Warning: This is just a suggestion and we do not guarantee profits. We advise you to analyze the chart before opening any positions.
Wish you luck
FTMBTC trade ideas

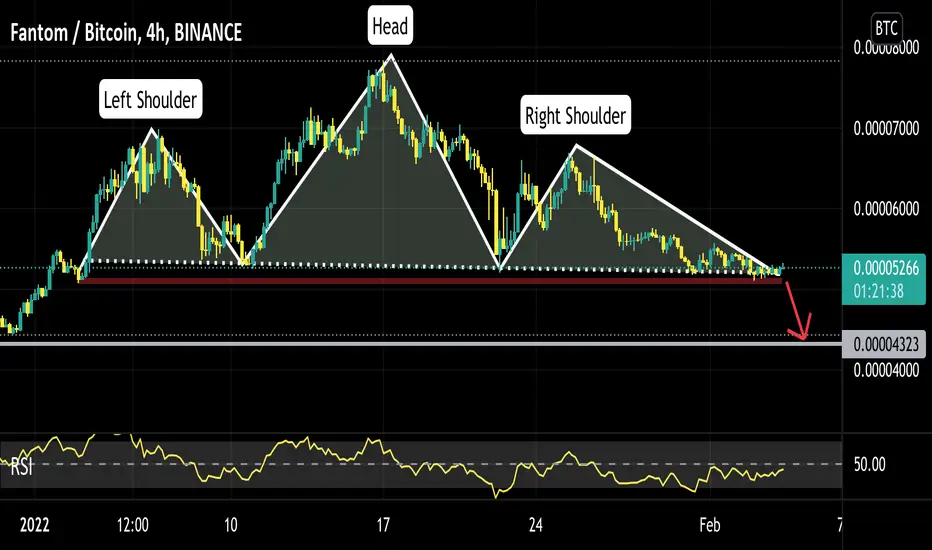
FTMBTC SHORT#FTMBTC
HEAD AND SHOULDERS playing out on 4HR $FTM chart.
Looking to short on confirmed breakout of 0.00005050
FTM/BTC (Fantom Coin) Preparing for Another Epic Leg Up >2XBINANCE:FTMBTC is one of the most beautiful charts I've seen in a while. Fantom is a smart contracts network that has grown about 100x in the past year. In this video, we analyse the charts and give our future outlook.
You can view this chart here .
If you like this video, then please leave a like. If you would like to see more, then please follow me. Thank you.


FTMBTC - Best Time to BuyDespite the head n shoulder pattern, and what most traders think, I think now is the best time to buy, and it will go for ATH
Lets see
The current price: 0.0000506
(Personal idea, not a signal)

FTMBTCGeneral Guide:
1.) Anything above price is a resistance, anything below is support.
2.) Proceed with caution when taking a trade based off of this chart.
3.) Make a copy of it to watch it in real-time. Click the share button, then "Make it Mine"
4.) It is very risky to set limit orders, I advise you to set alarms and when it hits, check how it reacts.
5.) Watch the BTC pair closely as price will generally follow that pair.
6.) Definition of Terms:
Bearish/Bullish Order Block (OB) - Price rejects or bounces respectively.
(Monthly/Weekly/Daily) Liquidity - Where retail stop loss orders are.
pm/pw/pd/pr - Previous Month/Week/Daily/Range
VAH/VAL/POC - Value Area High/Low and Point of Control (70% of traded volume in a range)
OTE - Optimal Trade Entry
Rectangles - Liquidity Pools
Diagonals - Probably a Fib Resistance Fan, Pitchfork or Pitch fan
nPOC - Naked Point of Control
Eq - Price Equilibrium
Single Prints - Liquidity Voids

FTMBTC At Price HighsHi and Good Morning,
The FTMBTC price is within a bearish zone having dropped from the 0,..6443.
So the price here is far from being bullish unless it spikes above 0,..5917.
If a bearish candle breaks the Low, then the prices should continue to fall.
It needs monitoring.
.
Khiwe
On this profile page, the shared analysis, ideas, and also, the strategy of a chart belong to Khiwe with some being influenced. The technical set-ups are speculative, they are not guaranteed for accuracy or completeness in the form of any content; -it is not to advise on financial markets. Please apply your own analysis and confirm it with price action.


FTMBTC this can go down HARD!FTM ending a wave 5 cycle with a clear H&S pattern which targets a break of the long term log ascending diagonal.
This is the daily so we can have some up movement on shorter timeframes to RS top levels but this looks very bearish.
Check out my upcoming FTMUSD analysis for more info.
BE CAREFUL

$FTM, testing a strong descending trendline $FTM
Something to look as its testing a strong descending trendline
UCTS its showing Buy signals on lower timeframes.
⏳
#FTM


FTM/BTC ATH continuation blablablaTitle says it all - FTM is at ATH agains BTC and if it breaks here it has a lot of upside, more than previous ATH against USD that's for sure.
this is a test to show what Fuzzy wants for unidex, the aggregator of aggregator for most blockchains out there.
This is a test btw to show what Fuzzy is talking about (I think).

Trading Series: $FTMGonna short it to hit correction. NFA, DYOR.
(tbh i'm bullish af on this coin at the moment, this bullish scenario may very well continue for reaching a new price floor!)

FantomThis is my idea of analysis, and buying and selling and making decisions is up to you. I hope you are successful

ovationshort and sweet.
drawing;
- ABC correct., zigzag535
- cup formed, possible handle forming if hit resistance (purp, dashline)
- continuation of tall 3rd wave, or starting short 4th wave, within a grande 4th wave...
might have rushed this one;
will check for chart corrections later.

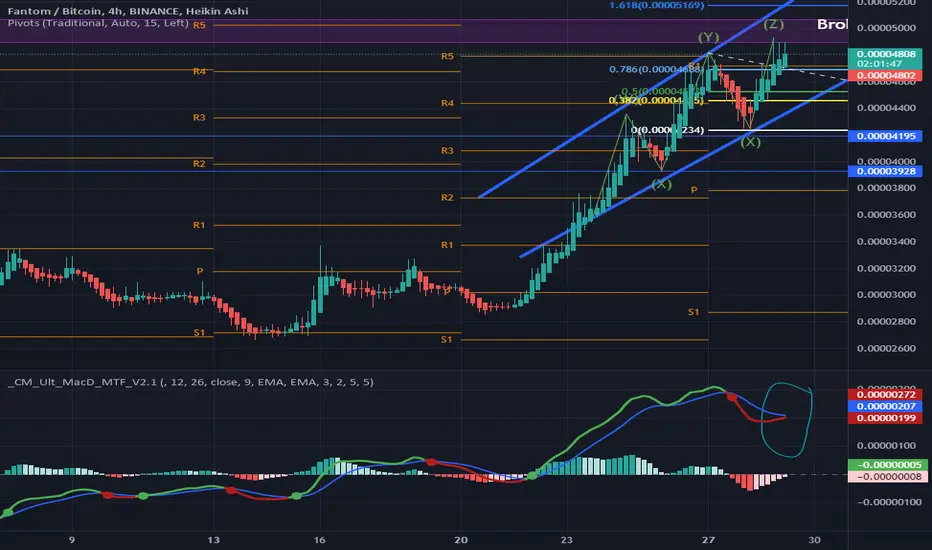
Going in a upward channel Going in a upward channel, and in front it is resistance 0.00004488, and in case it breaches the first target, 0.00005337

Bye FTM <3One of my favorites is about to make another run up. Watch for this bounce....
#notadvice #neverinvest

Fantom Grows by 12,400% Since January | Long-Term Winners!Fantom (FTMBTC) is not to be outdone by the other big winners and has grown a massive 12,400% since January 2021, WOW!
The way the chart is looking now there is room for additional growth.
I am sharing these charts today in order to try and bring some awareness into the bigger picture.
We need to think long-term.
Plan long-term.
Trade long-term if we want to win in this game.
When you really have experience, 3-5 years earning trading Spot, you can move up to margin/leverage/futures and so on.
But, you need to be successful being patient first.
If you can't make money in 3 years you won't be able to make it in 24 hours.
People want to make money fast, earn within a week and sometimes in just a few days, that's their idea.
But instead they have been losing money for years and there is absolutely no gain.
Focus on getting out in profits first, regardless of how long it takes.
Once you have been a winner for long, you can consider winning right away.
Namaste.


A reversal on the wayWith a nice h&s pattern the wedge seems like to be broken to reflect the bears power in the upcoming days

add it to your BTCDuring market crash it would be a good idea to work on pairs based on BTC instead of USDT. in FTMBTC pair, oscillators are bullish and we are so close to a strong support area(blue box). it can be an opportunity to increase your BTC.

Final Leg up 👉 Expanding Diagonal Formed At The FTM Chart ,Its a Bearish Pattern ,But We Expect The One More Leg Up To The 5400 Sat Then New Corrective Cycle Will Start
