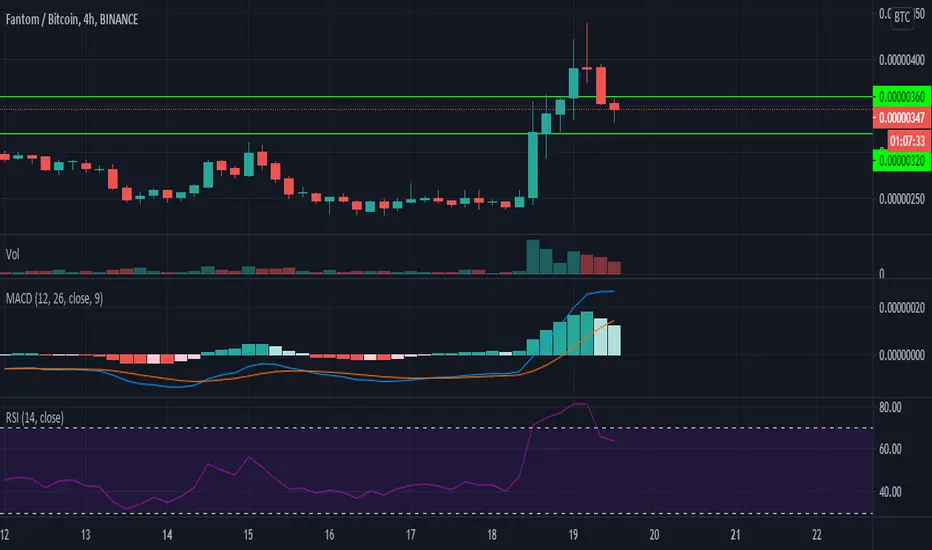
FTMBTC - UP OR DOWN? BULLISH RSI + MACD - Consolidating nowWill it pump or will it dump?
I don't really know what I'm doing so please let me know what you think.
RSI and MACD divergence - both building while price remaining steady. Looks like a potential big move to the upside if support is maintained.
Next Support: 100 Sats
Next Support: ~60 Sats
Targets Marked - what do you think?
FTMBTC trade ideas


FTM/BTCThere is nothing much to say, but looking at the Stoch RSI it looks bullish, if history will repeat itself. We all hope BTC does not have a major drop which would drastically affect all alts


FTM-BTC LONG scenarioGreetings,
The coin is traded on several major exchanges, trading pairs BTC, UDST and ETH are available.
On the daily chart you can see that the accumulation phase was from March to June, after which the coin went into pump mode and in September reached a peak of 500 satosh, from the bottom of the price rose by 1100%, a magical profit for those who have strong hands and steel ... you understand.
At the moment, the price has fallen from ATH by 80%, it hurts.
In terms of horizontal volumes, we can see that the price has settled in the area where the biggest trades were held in the 110-130 Satosh range, and at the moment the volatility is clamped in a symmetrical triangle, like a spring with a 65% base. This figure of uncertainty, and can work out 50/50, can become a reversal figure or a figure that will continue the downward trend to the next support area 75 Satoshas.
The purpose of working out of the long scenario of 200 Satoshas, and I will wait for it, as now there is no point of an input yet. The additional signal to buy will be the increased volume of buyers at triangle breakdown. Also, we can most likely see a false breakout and the reset of clips under the support of 110 Satoshas, if it will be short term it is quite acceptable, but if the price is fixed below the support, especially in the daily chart, the scenario is canceled.
Always use Stop Loss and do not use a leverage greater than x3.
A trader should always have tomorrow.
If the information turned out to be useful to you, put up a liking and sign up so you don't miss anything.


FANTOM can fly...We have long term support on chart and like always fantom (FTMBTC) can start a bullrun like italian bulls 😜


FTM 4HR ANALYSIS FTM/BTCLooking at the chart, you can see that the spot price almost hits the support level that has been reached before the massive breakout.
If the current support doesn't hold, I think that the support level may be reached again.
Also, the sell volume increased in the past days, which doesnt show any sign of reversal.
Will be looking close at this chart for the coming days/weeks.

FTM/BTC (Bearish Retest?)💎Technical Analysis Summary💎
BINANCE: FTMBTC
-Fantom broke the key level of support last Oct 16
-A Bearish candle closes below the support area
-This past two days, the price is testing the previous consolidation area
-If this level turns out to a new resistance area
-It will trigger a Bearish bias on market structure
-The price could go back to 180s sat area
A big Thanks for donating 💰 via Tradingview coins this week to billstenzel 🙏🎉
``````````````````````````````````````````````
Trading Involves High Risk ⚠️
Not Financial Advice 💸
Please Exercise Risk Management 💱
``````````````````````````````````````````````
Thank You All!🙏😊💖For Supporting My Channel 📺
Through Leaving A Thumbs Up, Comment & Follow 💬
Happy Trading!😊💕💖
``````````````````````````````````````````````

FTM/BTC (Good Reaction at Key Support)💎Technical Analysis Summary💎
BINANCE: FTMBTC
-Fantom touches the key area of support
-The price is reacting to the area and we can see a green candle
-The Bulls are trying to push the price above the support area
-This is a good sign in the short term
-But 1 candle is not enough to reverse the trend
-Let's observe for a few days and see how the market develops
A big Thanks for donating 💰 via Tradingview coins this week to ahancock 🙏🎉
``````````````````````````````````````````````
Trading Involves High Risk ⚠️
Not Financial Advice 💸
Please Exercise Risk Management 💱
``````````````````````````````````````````````
Thank You All!🙏😊💖For Supporting My Channel 📺
Through Leaving A Thumbs Up, Comment & Follow 💬
Happy Trading!😊💕💖
``````````````````````````````````````````````

Bullish momentum FTM/BTC.Hello, traders.
We are testing an Uptrend line for this asset, which is bullish in my opinion.
If we close today's candle above that support will give power to the bulls control the price of this asset and continue the uptrend movement.
Good Luck.

Falling Wedge at the 786I took a position at the bottom of this falling wedge, confluent with pivot s1 and the 786 retracement. Targeting the VAH of the current trading range.
Let's see how this one plays out.
Keep it simple, manage your risk, and don't get rekt.
//Disclaimer: This is not financial advice.


FTMBTCFTMBTC
Buying around 0.00000371 - 0.00000317
Targets around 0.00000426 - 0.0000048
Breakout of 0.000003, the price may fall below
f you like what I do, put 👍 and subscribe
Waiting for your comment, what do you think about this?

FTMBTC - Long - Potential 22.35%FTMBTC - Long - Potential 22.35%
Enter- 264
TP1- 291
TP2- 326
SL- 235
Happy Trading! Like & Follow if you Agree!


FTM/BTC (Retest Trendline Support?)BINANCE: FTMBTC
-Fantom tested the 50D MA last Sep 5 and we saw a strong bounce
-This time around, it is likely to test the upward trendline of support
-If FTM holds this area, we might see an upside move up to 352 sat
-But if the support trendline failed, The next potential support is at 209 sat
-Please always follow your trading plan
^Trading involves High Risk
^Not Financial Advice
^Please exercise Risk Management
**If you like my daily Published Ideas
**A little help by supporting my Channel
**Through leaving a Thumbs Up, Comment & Follow
**Happy Trading! --> Thank you! :)


FTMBTCBuy zone: when hitting the lower leg of the triangle (230-260)
Targets: 370
600
SL: Daily close below 220
