FTM short after retraceFTM has been on a steady downtrend, and is looking for a new leg up, not only technically but also fundamentally. A lot more users are starting to discover the possibilities of the FTM ecosystem.
Presuming that the trendline from ath is respected then we can see FTM reach the $1.8 zone which is an optimal place for longs.
Watch for rejection from the support trendline (red dashed) and keep tight stop loss.
If we get confirmed breakout from descending trendline (red) Raise stop loss to breakeven.
Depending on whether the overall market is bullish support should hold, but with the current situation a shakeout is possible.
FTMUSD trade ideas

FTM Dude, make it stop!Well, that is a pretty impressive Head and Shoulder that just completed.
Your call to go long, I just grabbed bags of FTM
Good Luck

My Coin of the Year 2022 - FantomHey Trader,
Today I want to introduce you to my favorite Crypto Pick for the Year 2022/2023 - Fantom.
I'm a purely technical trader, I indeed am interested in fundamentals since I am very interested in economics but the key for my decision is always the chart. The Chart on Fantom looks just amazing. As you can see I use Elliot Waves for my technical analysis. In this case we have already printed wave 1 and 3 which leads to our last Wave of the first Cycle - Wave 5.
What's really interesting here. is, that our Wave 1 and Wave 3 are very similar in length, which leads to the conclusion that our last wave has to be longest. Usual targets for an extended fifth are in this case either the length of wave 0 to 3 or the 162% extension of wave 1 to 3, which leads to the target of around 3500 $.
Based on this knowledge I see high chances of FTM to become one of the best performing Cryptos for the next year.
Let me know what you think.
This is no financial advice, just my technical opinion and view.
RT


Fantom (FTM) looking strong despite global pressureFantom (FTM) looking strong despite global pressure.
The RSI support proved as valid another times - very nice.
What do you think? Can we see an ATH? 😎
Drop me a nice comment if you'd like me to analyze any other cryptocurrency.
*not financial advice
do your own research before investing

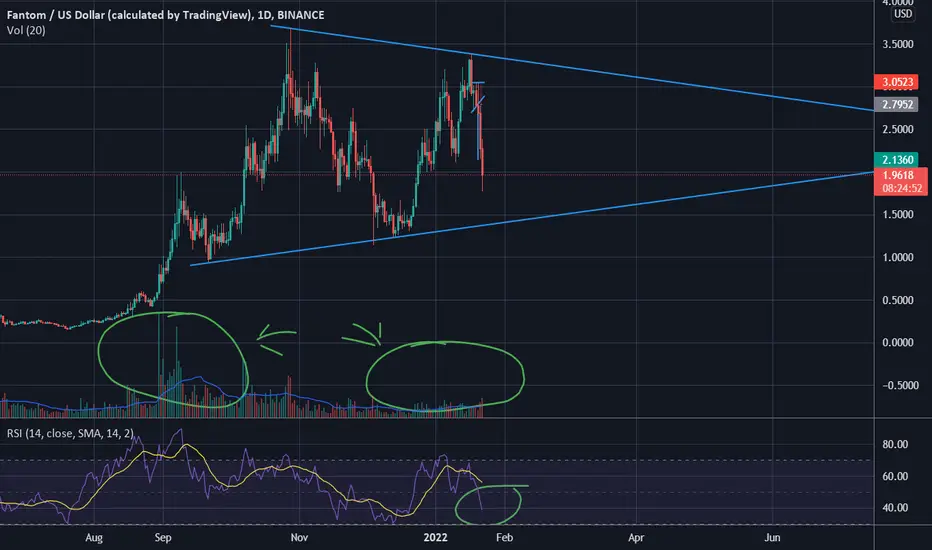
FTMUSD signal convergenceFTMUSD telegraphed current market conditions with a convergence of signals.
The black line indicates the day we could safely make a decision with proper risk management, by making sure we wait for patterns and signals to completely mature before making a decisive move.
1. On 17 January 22 FTM was trading above $3.00. That day it reached a local all-time-high, meaning on this particular time frame of a few weeks. The resistance trendline formed by price action (1) shows an uptrend.
However, all of my other indicators signaled an imminent failure.
2. Volume was in decline (2). Old school traders used to say wait for volume confirmation, though I see that less and less now. However, in this context, volume is confirming a weakening of purchasing. You can then see, right of the blackline, an increase in selling to present.
3. The relative strength indicator (RSI) showed two signals. A bearish divergence illustrated in the trendline, which is also a failure swing. RSI has been extremely useful in FTM and SPELL recently and I've watched it very closely.
4. The awesome oscillator (AO) showed a bearish "twin-peaks", which diverged from the price action as well. This demonstrated again a weakening in total momentum.
Using all these indicators to back a theory has become a cornerstone of my charting. Price action alone may not have telegraphed this movement, and if you combine that with good money management principles you could trade this. As an investor (long term holder with staking and farming yields) this tells me when to save cash for discount prices. In addition, in tells me not to rely on yields from liquidity pools that are pegged to this asset. Perhaps, if you were so inclined, this would have been the time to rotate liquidity pools to stablecoin farms, or other strategies.

FTM perp long position Ftm has formed a double bottom but I am not sure of a reversal till I see a confirmation

FANTOM ECOSYSTEM (Request)- FTM is one one of the big winner in this bullrun, the price seems low in price, but i checked many indicators and noticed that FANTOM was bullish 80% of the time.
What is the Fantom ecosystem?
The Fantom Foundation is building a highly scalable blockchain ecosystem that facilitates decentralized, scalable, and secure technologies. Fantom is a fast, scalable, and secure layer-1 platform built on an aBFT consensus protocol. Dyor it if you want to know more about FTM.
- Basically, i don't see this coin retracing for now, but like always, all depends on TheKing. So manage your % investment.
----------------------------------
Trading Plan
----------------------------------
- Buy : Now
- Rebuy : 2.5$
- Rebuy : 2$
TP : 4.95$
----------------------------------
- Check in comments for Older Analysis.
Happy Tr4Ding!

FTM - Triple TopFTM - Long....Tripple top is imminent in the coming days.
Like this idea? Please do thumps up...Thank you for watching.
30 days forecast.
Disclaimer: Take trades at your own risk.

FTMUSD multiple time frame / candlestick analysisWhile this macro pattern is concerning, the short term gives hope. As shown, the last 1D candle was very bullish. Reflectively, the underlying 4H pattern looked like a typical bottom pattern. Bitcoin also printed a bullish candle in this time frame, but the macro pattern would need to confirm to invalidate this.

$FTM Bounce Plan 1/24/22Hoping for a macro bounce into supply before continuation of bearish macro downtrend

FTMUSD (4H) Bullish reversalHi Traders
FTMUSD (4H Timeframe)
Waiting for the upward break of 2.39 resistance level, which will complete a bullish trend reversal pattern to go LONG. Only the downward break of 1.90 would cancel the bullish scenario.
Trade details
Entry: 2.39
Stop loss: 1.90
Take profit 1: 2.69
Take profit 2: 3.18
Score: 4
Strategy: Bullish reversal

FTMUSD ahead and shoulders formingBTCUSD is printing a large double top. In response, FTMUSD is forming a bearish head and shoulders. Now, traditionally many traders used to say don’t trust an HS if the support line is off X axis. Either way, it’s testing this support trend line for the third time. BTC would need a rally to turn us around I fear. On chain indicators show some room left to go lower.

FTMUSDT Short Idea All cryptos are facing big corrections right now, with Bitcoin down 10% since last week. FTM is one of the only Alt-coins that hasn't seen a big price drop yet, due to the trading volume and market capitalisation. However as BTC usually drives this market, it's likely for FTM to also fall from its current levels. To mitigate risk, the stop-loss is 5% from the entry point. The target is a retest of the previous support level, $1.45.

FTM/MATIC 2023 TargetsAfter retracing to 0.75, resistance will be met above, as shown. I would write the values here, but I can't see them as this Publish Idea window overlay blocks the chart.

Fantom preparing for its next bullish extension - Target $ 20Hey Trader,
please see my Current idea on Phantom, where my count suggests an impact of our Wave 3 at around $ 20.
For further information, please see below.
This no financial advice.
RT

FTMDaily Crypto Report
FTM sitting at a very critical support level. The 1.82 support level also coincidence with the fib golden pocket retracement. If the 1.82 support level is taken out then it will be an easy ride down to the 1.29 and then 0.93 support level. FTM does seem to have a double top breakout to the downside with increasing volume so it might retest to the blue lines and then sell off. A full measured move for the double top is down to the 0.93 level. The double top can only take place if it takes out 1.29 support level. I also want to note that on the weekly chart it is doing a bearish engulfing candle. I'm staying neutral until the 1.29 level can be taken out.

DONT FREAK OUT!! FTM is still in consolidation.On the longer term chart we can see that FTM is still in a bullish consolidation pattern. Even though we had a decent drop this is the best thing that could've happened for fantom on the long term. If we can get a third confirmation of the lower trend line as well as the upper, this pattern will be confirmed. Remember though, even confirmed bull flags only break bullish 60-70% of the time. Patterns can fail and do all the time.
I expect FTM to break out of this pattern sometime april-june, as these patterns usually don't exhibit breakouts until the price action has moved to about 70% the way through the pattern.
Notice where I have circled the volume. The volume now is much much lower now than it was when FTM was in a rally. This is also supports the idea that were still in a consolidation pattern, however a long-term one.

FTM Short after it's next rallyFTM is a fantastic project and I made a mistake not holding this short and entering long on TOMB Finance.
It will bounce as BTC will over the next week or 2 and most likely regain over the 2.1-2.2 area, here I will be exiting positions with whatever cash is left and entering short for the weeks afterwards. I will accumulate more FTM on the way down but it is never good to catch a falling knife. This chart looks to be a few weeks behind BTC's, which means it could fall 50% from here still.

NEW ATH IN FTM IM PRETTY SURE HERE IS THE NEW SOLANA.Goog point to. buy right now for your porfolio is gonna be more bogger than solana in the next months trust me
..
.
.
.
.
.
.
.
..

FTM to $2.13 levelFantom just broke bearish from this continuation pattern which is nestled inside a larger H&S pattern.
FTM also rejected pretty hard right at the top of the red ichimoku cloud.
Both patterns give a target price of around $2-2.2
I am expecting FTM to pull up a bit and touch the trendline it broke out of before continuing to the downside. This would be optimal as it would reset the RSI on lower time frames for a continued downward move.
I have set up on the chart my intended play with take profit and stop loss levels.
This is not financial advice. Trade at your own risk.
*NOTE* If fantom does not retest the trend line I will likely set up a long position after the price target has been reached. FTM needs to do this rather soon or else it will continue to fall, in accordance to the ichimoku.

