$FTMThe Fantom price keeps finding support on its previous bull pennant pattern. Now, it looks like it's forming a triple bottom pattern on the 4hr. I'd be looking to see price break above the white line, retest, and keep moving up. The MACD and Stoch RSI also look bullish.
FTMUSD trade ideas

Fantom longFantom bounced off the support area. Asset bounced off the ascending trendline. Bullish movement to resistance level at 3.38 is expected to happen.

$FTM$FTM - Identical Repetition over Time
$FTM looks - Parabolic Step curve in making.
Having a close look at the Chart one may observe :
Scene 1 : Might Go further down to Yellow rectangle zone to reach green line or
Might get oscillated in Yellow ranges.
Scene 2 : IMO - this is most likely., as the coin heads down to Green Line to make new ATH.
$FTM might do a $LUNA or $SOL IMO., considering a long term prospect.

FTM Fantom rejected by GANN trendline...Big fall may be coming.If FTM does not hold 2.86, there is a weak support at 2.50.
However the only strong support is way down at 2.00,
which is also the FIBONACCI 61.8% level & dma200.
Also looking like a running flat correction.
Not financial advice.

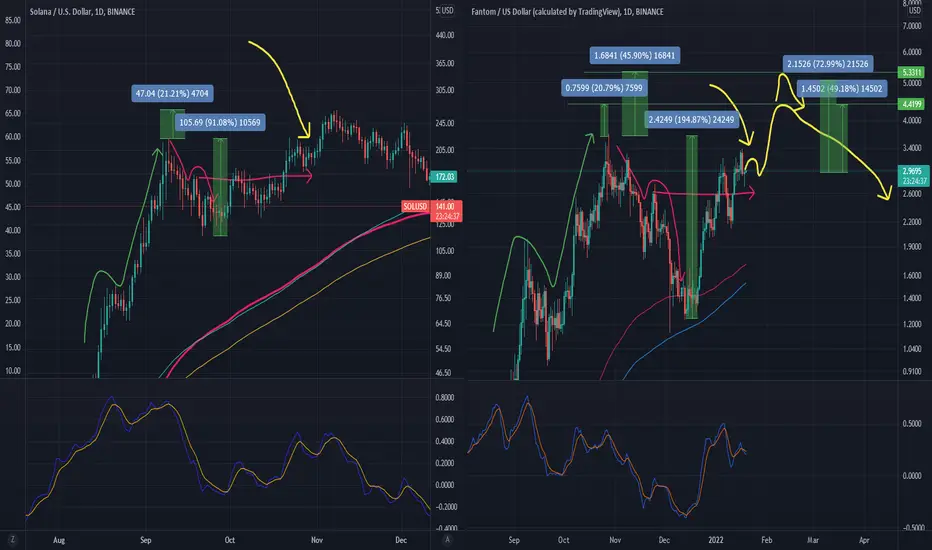
FTM - SOL comparison - Interesting TOP formationspretty self explanatory. looking at topping price actions here.
ive tried to keep proportions the same. you'll note FTM moves harder than SOL. prob because it's much smaller cap.
maybe we repeat SOL's topping price action with FTM . ill be watching this one.
does btc play ball here?
gl
FTM trend retest confirmationFTM FA bullish as hell with strong efi and TVL some of the highest in the space. this retest is bullish and huge for the next leg up for fantom. i could see 3.5 blown past and 4 within sight.

fantom price actionftm bullishness is not yet confirmed ,it will give one more bear move to the down side

Cup n Handle Breakout-Long FTM Nice risk-reward of 4.66/1.
Entry around 3.2 with a Target of 4.75.
Stop-loss 2.78

Cup & Handle FTM LONGFTM has formed a cup and handle pattern. Bulllish
FTM has a lot of hype right now. Bullish
FTM in my opinion is undervalued.
FTM LONG BABY!!! LFG

FTM Warriors - Possibility 1 or Possibility 2?FTM Warriors
Possibility 1 or Possibility 2
Where shall we go...

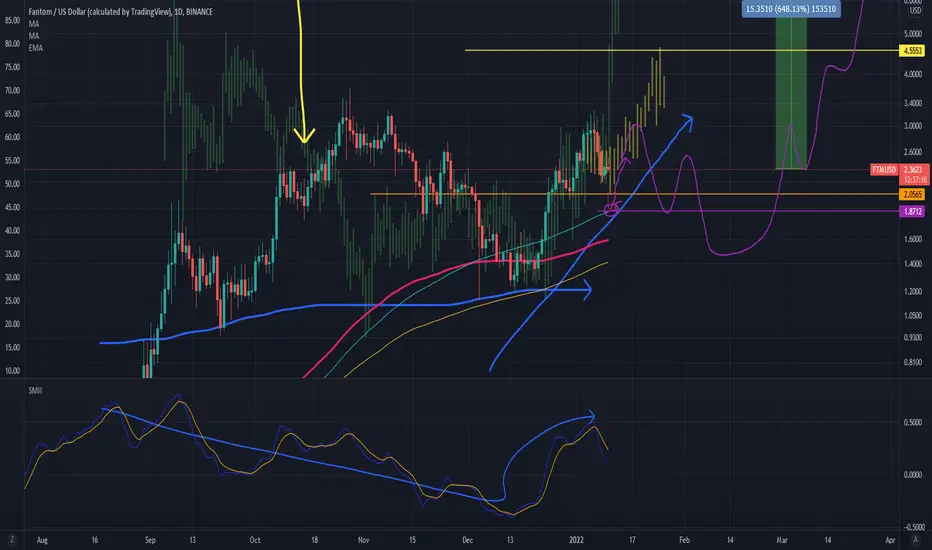
Fantom analysis : UPDATEFantom analysis : UPDATE
last idea/fractal went to shit.
Various options/fractals im looking at. im thinking purple. zoom out to see properly.
This Chop is gonna be fun. Hopiumly its that bull tard option but i somehow doubt it.
gl
FTM BULL FLAG FORMINGI called the bull penant two days ago, now we're looking at a bull flag. Heading up to retest all time high at $3.50 then to the next .618 at 3.70 I believe.
With TVL we're looking at a monster in the making if BTC dont shite the bed.


FTM IS A SUPER ROCKETHello guys, i am gonna tell you that FTM is gonna hit $4 make sure and this is great blockchain and this price wiill give you huge profits if you hold FTM..
thanks alot

FTMUSD 2-timeframe and candlestick analysisI dub this 3-day 1D candle pattern "three rockets". The first is a continuation candle and the other two are bullish hammers. Interestingly, 4H candles in the highlighted callout print a little consolidation wedge.
Some on chain indicators I'm viewing such as the Reserve Risk on BTC show us entering the lowest point (think oversold) since November 2020. The rest are somewhere in the middle, so I continue to believe we aren't through with the bull cycle.
Lastly, we punched strongly through the resistance trend line . If the 1D closes over this, and BTC at least holds its price level, I'm bullish (for now).

FTM - Short term indecisionFTM 1H is in a bull pennant grinding around key order blocks. A breakout of this pennant will determine bull/bear stance as a good example of ITTT. Bear scenario = hns plays out back to POC. Bull scenario = 3.48ish for fib targets continuation of bullish impulse, macro channel reentry then valhalla...
Long term bullish.

FTM Channel EntryFTM has taken it's date to the movies, the park, and the beach. Now it's looking for a channel entry.
Yellow magnet acting as a price hot spot. If channel is reclaimed, we look for the 1.618 purple magnet.


FTM DOUBLE TOP AND H&S IN PLAYI think that FTM will reverse for a bit,
TP: 2,20$
Watch out for 2.8 level if it breaks it will go down to 2:20-2,40 levels

FTM/USD ShortHead and shoulders Pattern - Short.
I think a reversal pattern will play out in the short term.

