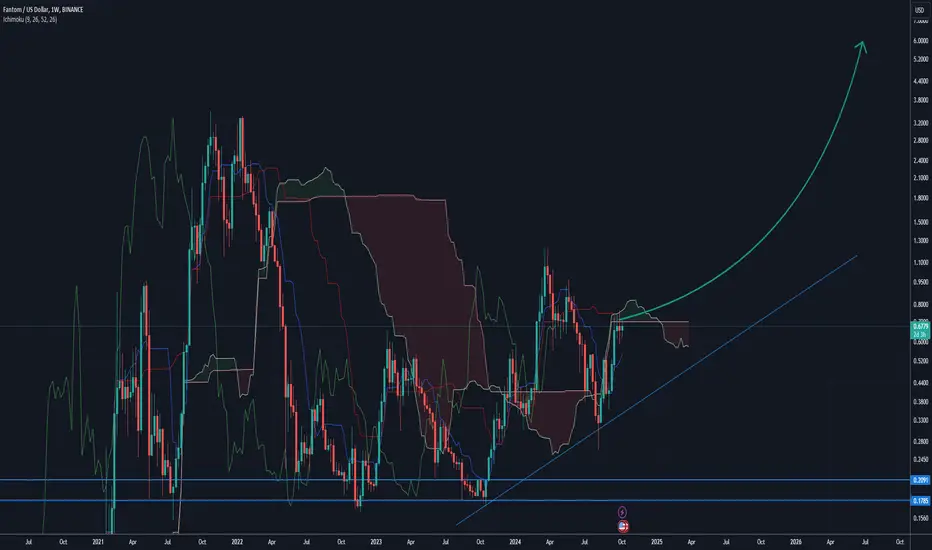
FTMUSD Trade setupAccumulate in this area, FTM is primed in Q4 2024 - Q1 2025. Sonic will generate new ATH's.
FTMUSD trade ideas

#FTM FANTOM COIN LONG POSSIBILITY - ALTCOINI will be watching to marked 'Long Zone' for possible long position.
LTF confirmation will be needed in order to open position.
Possible target would be the purple line.
Risk assests are doing good recently but we have still geopolitical risks currently.
Nothing i share is financial advice. Education purposes only.

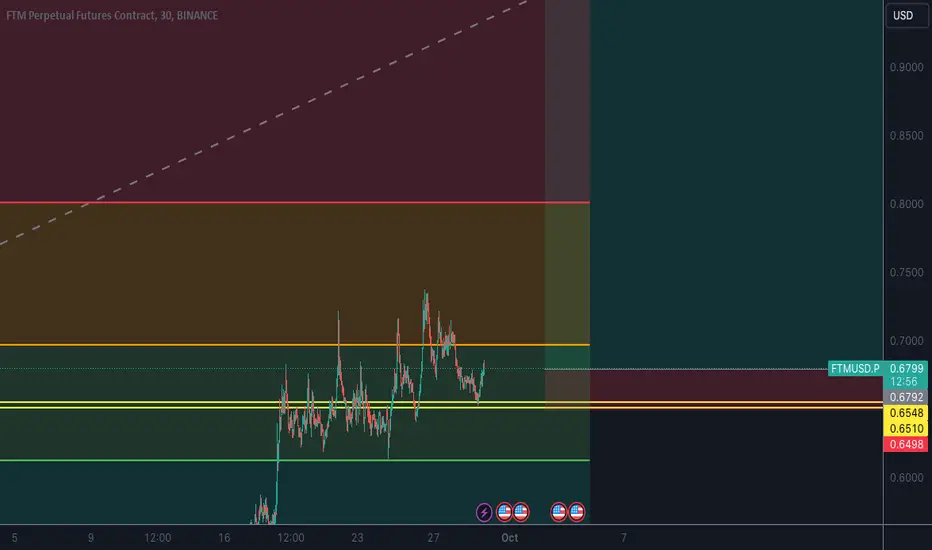
FTM LONG Bears failed to drop the price below 0.6 .
0.58 - 0.55 demand zone acting as strong support. Coincides with golden zone for current wave retracement between 0.5 and 0.618 fibs.
Bulls fully in control from here. Next target for long TP : 1.02.

FTM Short : Bulls ExhaustedLooks like bulls are exhausted from recent up trend. 1.618 fib point should have been the take profit for most long traders. Price broke below demand zone at 0.618 indicating increasing sell pressure. Same demand zone is now acting as supply zone (resistance that bulls have failed to break above.
Short position from here.

Head and Shoulders with price retestA drastic dip occurred with week buy action. FTM value has been reset to the low 0.60 zone. I expect a price bounce from the head and shoulder retract. I called a head and shoulder earlier this week on the XRP chart, and FTM has also followed that trend. 20MA and 200MA are still playing the break for all long positions. The moving average holds uptober excitement, but we will have to wait and see if it will hold strength and value next week.
Support - 0.56
Resistance - 0.65
Momentum - Low
Volume strength - Sell
Fear & Greed Index - Greed (73)
Fundamental analysis—With new price discoveries, it has been a rough week for all cryptocurrencies. I've noticed that the world crisis events will determine crypto price bounces. A lot of selling occurred with whale accumulation.

FTM update pushing momentumFTM is hitting the momentum Fib, the ever important signal of strength and momentum in my opinion. My late November target still remains pictured as the circle. There is moderate resistance around the next Fib but a wide range after that. The weekly stochastic might need a bit of a reset but the daily is just getting started. I would love a confirm above this Fib here, and then a pullback to build support above it.
Short- Term = a test of 85 cents
Mid term- my target Nov 11 =1.3$

Symmetrical TriangleFTM is breaking resistance for the third time. A possible Symmetrical triangle has formed to continue the upward trend. 200 MA is still playing the break. Value should play above resistance in the coming days, fighting for higher highs and new lows.

FTM Uptrend ContinuationPrice retraced and found strong support at demand zone around 0.65.
We can take another long position from here with SL slightly below low of the demand zone. TP should be around 1 USD.
FTM Super Long Update The demand zone has been cleared . As a golden rule with trend lines buy on the second or third touch in respect of trend line formed and direction in this case upwards.
FTM to the moon from here

FTM Long : Rounding BottomFTM price has completed rounding bottom formation including breakout at neckline. Price has retraced and is in a very strong demand zone. Max long potential from here as crypto ltcoin bull run begins.


FTM Breakout Short RetraceFTM price finally broke out of falling wedge. A supply zone has been form on 1 hr at strong resistance point . Looking for a long setup when price retests this supply zone in readiness for pullback

Fantom Inverse head & shoulders to reclaim last six month lossesGood afternoon Lads,
The last six months have been very painful. I have been buying more and more crypto but my account goes lower and lower as things find their bottoms. But my total stack of crypto in terms of unit of account has gone up. There hasn't been much to post. But now I have a reversal structure in the shape of an inverted head and shoulders. So far this pattern has developed over around 70 days and its pretty close to the neckline.
This is basic charting and Elliot wave theory. Price had an initial uptrend. This creates an opportunity for profit taking and a pull back. We can see that in the ABC correction. We have completed a reversal pattern around what use to be previous resistance (the black triangle).
In short order we should see the price of fantom double. That is almost cute compared to what we are looking for in the long run.
Here is a Fibonacci extension our current impulse and correction. Hitting 1.618 and 2.618 targets is standard long term targeting. That is an 11x then a 90x if you have strong hands
Those targets become cute themselves when you look even further out.
In a year, when things seem to have gone absolutely crazy and crypto and the world has lost its mind I expect to see fantom up there over 700x. I expect massive and vicious pull backs on the way centered on the 0.618 and 0.786 levels. But that won't matter to me. I will have reached my financial goals way before then.
54 weeks are left in the cycle. The longer we go sideways after the halvening the better I see the upside being.

Short Term Outlook : Long to 0.48 RegionSpotted divergence on the 1HR MACD after the recent sharp price drop .
- There's a fair value gap still unfilled on the 1 hr chart as well at the 0.48 region . I see price reversing to this point from here.

FTM LongAfter yesterday's flash move down long opportunity arises . Price has retested demand zone and looks to fill FVG gap between 0.47 and 0.485.

Falling Wedge : Last leg down It's here.
If you've been following my previous posts then it's self-explanatory.
For first time:
Falling wedge pattern FTM daily chart. I think this might be the last wave down before a breakout.

Fantom: Come Back!We primarily expect a return into our orange Target Zone (between $0.3220 and $0.1866) before the orange wave v and thus the green wave comes to an end. After that, a sustained rise above the resistance at $0.54 should occur. However, as the price had already approached the range, the technical minimum requirement for the correction low has already have been met. Should we now see a rise above the resistance at $0.54 (33% likely), we will thus have to see the price in the orange-colored wave alt.i.

Falling Wedge Update : Prepare for next leg down I couldn't have drawn it better. Oscillators are in favor of bearish price movement as well and BTC looks to be headed for 40K .
Time for the last leg down before potential wedge completion.

FTM in Monthly Chart Hello
I do not want to talk about it because I have discussed a lot and this crypto coin is following most of other its teammates but the only point you need to mention is your psychology.
This is Financial Market and anything is possible, anything, do not forget that.
One of my favourite practices is to go to large timeframes and watch that market in simplest way without noises, I recommend it for you too.
I hope to buy FTM in its cheapest prices since January 2022.
Thanks

A risky yet legitimate Head 'N' Shoulders pattern on 4HR FTMUSA
So long as the BTCUSD price holds up during weekend trading this might pop to the upside soon, let's see how it plays out or if I get hammered down. There are opposing sell Head 'N' Shoulders setups on this same trade which complicates things a bit.

Falling Wedge Update : One more low (SHORT)Reevaluated the price structure to capture extreme lows and highs. This week looks overbought; should be one more drop before the boom. BTC price trend agrees

Fantom FTMUPCOM:FTM is still in a bearish trend.
A confirmation for a beginning of a wave C has happened in my view, therefore an impulsive wave with 5 inner waves shall happen.
Passing above $1.2776 invalidates the idea.
I expect the bearish move to end between $0.0772 : $0.0314 according to the Fibonacci retracements 50% & 61.8%, but precisely at $0.0606 due to the 100% Fibonacci's extension from the wave A up to wave B.
- Note: Taking the Fibonacci retracements & extensions targets as accurate or precise numbers is wrong. They're just used as guides to where the price is expected to bounce from or to go to.
