FTSEMIB - Negative Bias Continues Our bias on the Italian stock market continues to be short. The deadline for presenting an acceaptable budget to the EU is Oct. 15th, and no progress has been made. Italy still remains on an opposing foot and thus the markets are maintaining the pressure on Italian stocks.
FTSEMIB trade ideas

FTSE Mib going down since the electionsFTSE Mib is deeply retracing since May 2018, after the Italian political election, when the index broke the main trend support as well as the support offered by 50 and 200 days EMA.
Since May, the index is down 21% and overall indicators doesn't seem to suggest a reversion anytime soon.
MACD shows bearish signals as well as 50/200 days EMA diversions.
Current political situation increases the probability of the continuation of the retracement.
***As usual not a trading advice but merely my idea for information and educational purposes only***


[FTSE-MIB] BULLISH CONSOLIDATION?From a technical point of view, the Italian index could trigger something like a wave (5), and if this is correct, we do not rule out a new TOP in the medium term. That said, we can try to take a long position around 21.536/21.351, and put stop loss below 21.153. This setup has a good R/R ratio (> 1: 3).
if you think this analysis can be useful, leave a your comment or your LIKE!
Thank you for support and trade with care!


FTMIB HAS COMPLETED PRIMARY WAVE B TRIANGLE On the 23 of January the Italian index touched its upper trend line completing intermediate wave (E) of Primary wave B (circle) triangle. This triangle pattern has been under construction since the low of 2009 and is now complete. This touching of this upper trend line also coincided the the Nasdaq composite and the Nasdaq 100 touching the upper trend line of their trend channels completing their fifth waves within the same week. Most of the global indexes have all completed their fifth waves and have been in throw overs of their trend channels some since December last year causing fifth wave extensions in the DJI & S&P indexes. If the markets have been waiting for the Nasdaq indexes to reach their upper trend lines and fifth waves completed across all major indexes the stage should now be now be set for a major collapse across the global.
Indexes that have completed five waves and have touched the upper trend line of their trend channels theres a list of stocks and ETFs the trended inside parallel channels but I won't put them here.
DJT, NAST, DJI, US30, SPX, S&P500, IXIC, NASDAQ100, RUT, UK100, IN50USD.
Ralph Nelson Elliott noted that parallel trend channels typically mark the upper and lower boundaries of impulse waves, often with dramatic precision. Analyst should draw them as soon as possible to determine the end of a trend.


FTSEMIB Weekly - Update - 27/01/2018 09:29:28FTSEMIB Weekly - Update - 27/01/2018 09:29:28
Fourth week upward with decreasing strength
closing under multiday R1 support at 23879.84
it makes me think that the strength will continue to dim bringing even
a few negative candles in the next two weeks
which could lead us to test weekly support
placed at 23331.58
New high at 24050.15, which I think will not be retouched next week.
The next week I expect the beginning of a fall, to make it resume
breath to the trend, which remains firmly long.
Fall that should not extend below S3 to 23203.57.
Reached S3 will open two hypotheses, end of decline and new rise for zone 24118
continuation of the decline for another week by zone 22704
The weekly adx is positive in contraction, the Fisher indicator is firmly
long, therefore any rebates should not lead to an inversion.
The indicator CM_laguerre, is still lateral and gives no indication.
Weekly Resistance: 24050.150
Weekly Support: 23331.580
FTSEMIB Index - Last Value: 23856.99
CROC X1 - Supports / Resistances - Multiday (TF - 1H)
R1 = 23879.84
PIVOT = 23712.83
S1 = 23545.82
S2 = 23436.02
S3 = 23203.57
CROC X3 - Last Signal (Long Period - TF 1D)
LONG from 22011.59
since 04/01/2018

FTSEMIB Weekly - Update - 01/13/2018 10:24:25FTSEMIB Weekly - Update - 01/13/2018 10:24:25
Very positive week even the one just passed that has opened the way
to zone 23880, but that we will not reach immediately.
Next week I expect a bit of profit taking that will be there
lead to review area 23133
But be careful with shorts, strong hands are still all long and hunting
shorter's stops
The weekly adx has returned firmly positive, while the indicator Fisher has reversed
therefore, we still expect positive weeks, after the profit taking next week.
The CM_laguerre indicator is still lateral and not indicative.
Weekly Resistance: 23474,510
Weekly Support: 21613,890
FTSEMIB Index - Last Value: 23429.83
CROC X1 - Supports / Resistances - Multiday (TF - 1H)
R3 = 23879.84
R2 = 23545.82
R1 = 23436.02
PIVOT = 23319.80
S1 = 23203.57
S2 = 23133.42
S3 = 22923.11
CROC X3 - Last Signal (Long Period - TF 1D)
LONG from 22.011.59
since 04/01/18

Possible trend inversionWe can see a trend that is probably going to invert its raise by studying the EMAs and MACD 3/10. The croosing of the 2 EMAs (20 and 50 periods) is a signal of a changing situation, this is strengtened by the extended MACD divergence that doesn't confirm the new relative maximums.
If this trend inverts possible price goals could be found with the Fibonacci retracement.


FTSE MIB sell Opportunity Ftse mib 4h
Sell opportunity waiting for potential bounce point due to the confluence of fibonacci res. level at Midline of pitchfork!!!
Good luck!!!!!!

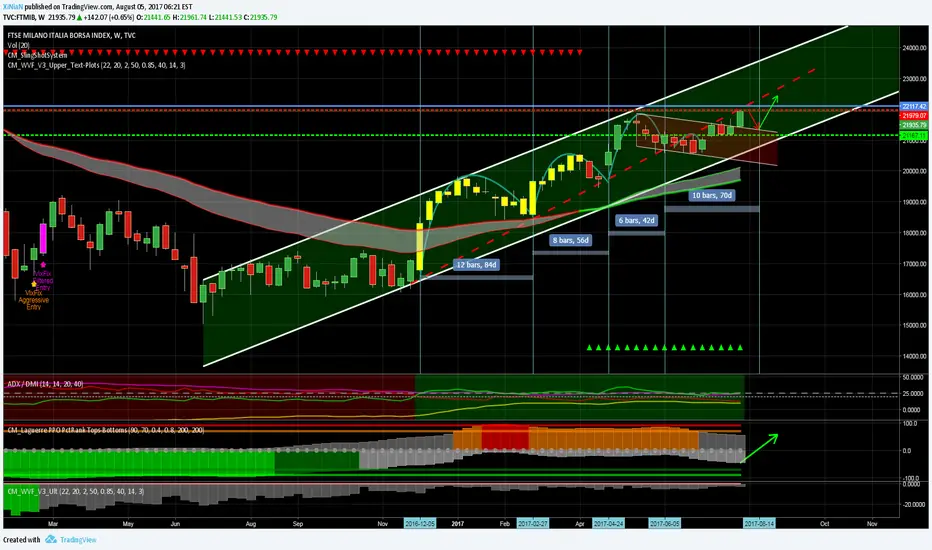
Weekly FTSEMIB still FLAT
Weekly FTSEMIB still FLAT, it's not yet indicative for the future
Weekly Resistance: 21916
Weekly Support: 21335
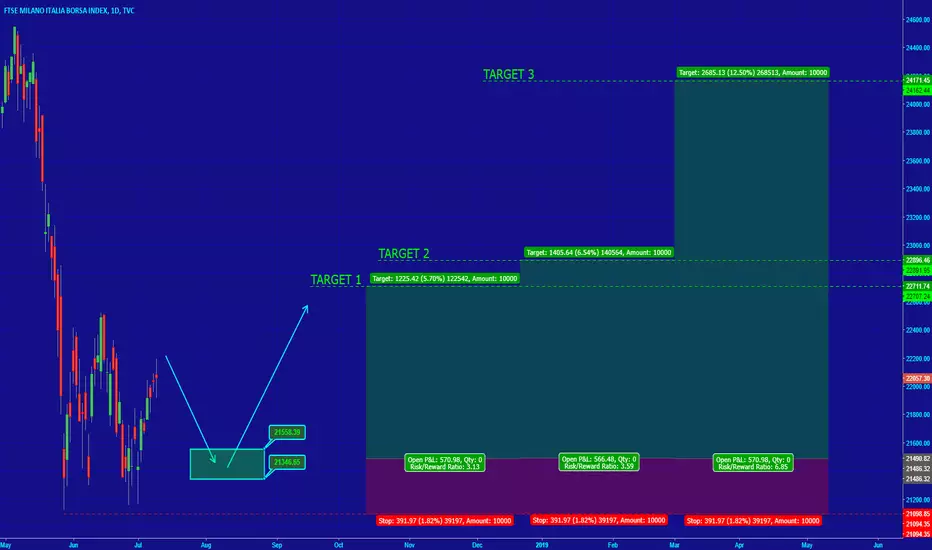
The daily breaking up of the resistance at 21916 has target in area 23000
while the daily breaking down of the support has target in zone 20537

Weekly FTSEMIB still FLAT
Weekly FTSEMIB still FLAT, it's not yet indicative for the future
Weekly Resistance: 21916
Weekly Support: 21335
The daily breaking up of the resistance at 21916 has target in area 23000
while the daily breaking down of the support has target in zone 20537

Weekly FTSEMIBWeekly FTSEMIB
The CM_Laguerre indicator is completely unloaded
so in the coming weeks it should return to go up.
Weekly Resistance: 22028.020
Weekly Support: 21329.210
The breaking of the weekly resistance with a daily candle will take it to the target in area 23196, while the breaking of the weekly support will take it to the target in area 20342 for mid-September

Weekly FTSEMIB that returns longWeekly FTSEMIB that returns long
Weekly FTSEMIB breaking the descending channel and canceling all bearish hypotheses
of previous weeks.
Next week will probably come down to testing the newly broken channel
then continue to try to raise to 22500
Weekly resistance: 21793,720
Weekly Support: 21149,290
Short only at 21149 daily break