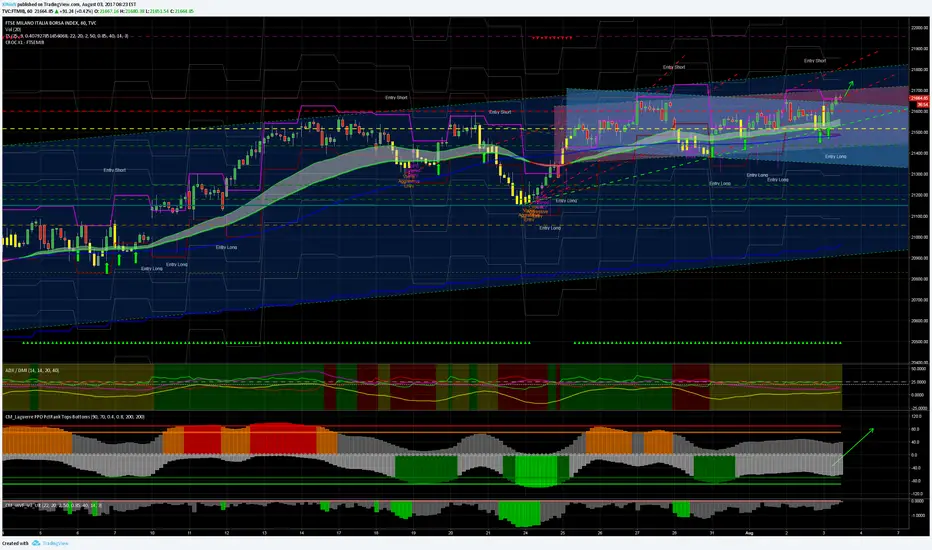
FTSEMIB - Intraday Entry long started
FTSEMIB Index- ADX / ADM - TS V. 2.9.1 - Intraday Levels for 03/08/2017
ADM - Average Daily Movement - Intraday Levels
Entry on close 1H (hourly candle) ... if exceeded the indicated level
LONG if > 21657.91
TP1 = 21750.91
TP2 = 21841.84
TP3 = 22027.84
Stop Loss = 21489.31
SHORT if <21489,310
TP1 = 21,396,310
TP2 = 21,305,380
TP3 = 21,119,380
Stop Loss = 21,657,910
"On my blog, find the detailed explanation of how these levels works"
FTSEMIB trade ideas

FTSEMIB - Intraday Entry long started
FTSEMIB - Intraday Entry long started
FTSEMIB Index- ADX / ADM - TS V. 2.9.1 - Intraday Levels for 03/08/2017
ADM - Average Daily Movement - Intraday Levels
Entry on close 1H (hourly candle) ... if exceeded the indicated level
LONG if > 21657.91
TP1 = 21750.91
TP2 = 21841.84
TP3 = 22027.84
Stop Loss = 21489.31
SHORT if <21489,310
TP1 = 21,396,310
TP2 = 21,305,380
TP3 = 21,119,380
Stop Loss = 21,657,910
"On my blog, find the detailed explanation of how these levels works"
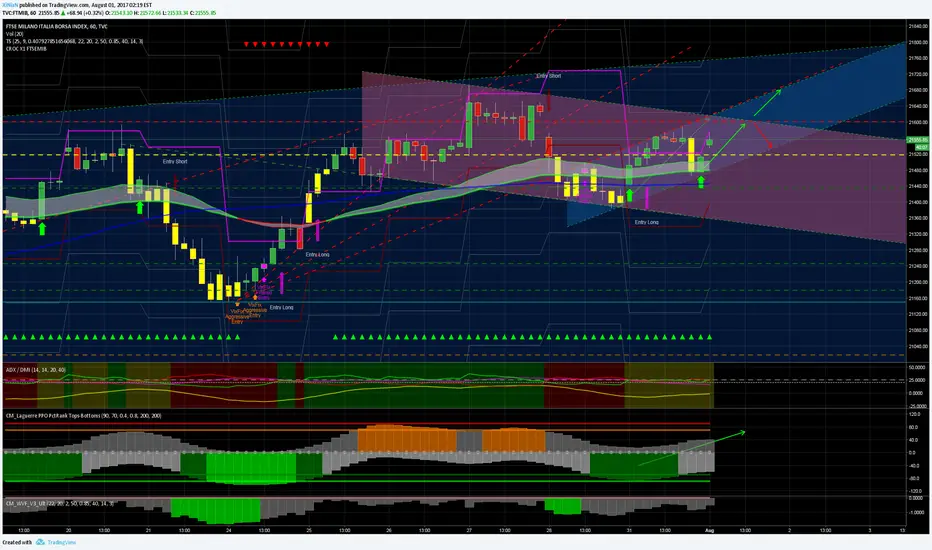
FTSEMIB, I expect today's R1 test at 21600.72FTSEMIB, I expect today's R1 test at 21600.72
Depending on the outcome you can continue to zone 21680, on the top of the
Short-term bullish channel, or return to pivot in zone 21518
FTSEMIB Index
CROC X1 - Supports / Resistors - Multiday (TF - 1H)
R3 = 22210.34
R2 = 22107.30
R1 = 21600.72
PIVOT = 21517.69
S1 = 21434.66
S2 = 21245.73
S3 = 21179.71
CROC X3 - Last Signal (Long Term - TF 1D)
Since 29/11/2016

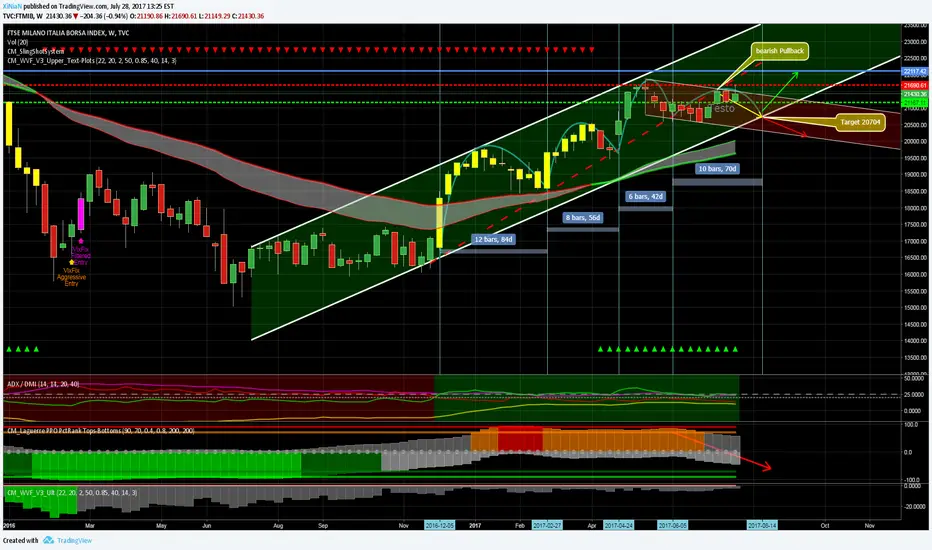
Weekly FTSEMIBWeekly FTSEMIB
No news in the weekly FTSEMIB
Bearish channel remained intact and target unchanged
at 20704.
Weekly resistance at 21690.61
Weekly support at 21149.29

Weekly FTSEMIBWeekly FTSEMIB
No news in the weekly FTSEMIB
Bearish channel remained intact and target unchanged
at 20704.
Weekly resistance at 21690.61
Weekly support at 21149.29
weekly FTSEMIB I will continue to remain of the opinion of the last week,
weekly FTSEMIB in retraction towards the 20704 target before of mid-August.
Weekly Resistance Now at 21592,820

Weekly FTSEMIBWeekly FTSEMIB
I will continue to remain of the opinion of the last week,
weekly FTSEMIB in retraction towards the 20704 target before of mid-August.
Weekly Resistance Now at 21592,820

Weekly FTSEMIBWeekly FTSEMIB
Weekly Closure that goes back to the pullback line,
It could be a weekly maximum .
If the hypothesis is confirmed it will be able to follow the test of the last two weeks minimum
at 20704, going to verify the holding of the bullish channel.
At this point if the test is successful it will be able to rebound again to zone 22117,
Otherwise it will continue in the bearish channel towards the zone 20000

The Italian index starts flat this morning...The Italian index starts flat this morning, we expect the break of one of the levels
intraday, for the departure of today's movement
FTSEMIB Index- ADX / ADM - TS V. 2.9.1 - Intraday Levels for 14/07/2017
ADM-Average Daily Movement-Intraday Levels
Entry on close 1H (hourly candle) ... if exceeded the indicated level
LONG if > 21626.42
TP1 = 21741.71
TP2 = 21854.44
TP3 = 22085.03
Stop Loss = 21417.40
SHORT if <21417,400
TP1 = 21,302,110
TP2 = 21,189,380
TP3 = 20958,790
Stop Loss = 21626,420
On my blog, find the detailed explanation of how these levels works

FTSEMIB starts flat this morning....The Italian index starts flat this morning, we expect the break of one of the levels
intraday, for the departure of today's movement
FTSEMIB Index-ADX/ADM - TS V. 2.9.1 - Intraday Levels for 14/07/2017
ADM-Average Daily Movement-Intraday Levels
Entry on close 1H (hourly candle) ... if exceeded the indicated level
LONG if > 21626.42
TP1 = 21741.71
TP2 = 21854.44
TP3 = 22085.03
Stop Loss = 21417.40
SHORT if <21417,400
TP1 = 21,302,110
TP2 = 21,189,380
TP3 = 20958,790
Stop Loss = 21626,420
On my blog, find the detailed explanation of how these levels works

FTSEMIB Weekly, Pullback done?
Weekly that closes with a pullback of the bullish trendline broken the previous week;
This would call a forthcoming weekly bearish candle which could eventually release the index from the lateral phase that has been going for weeks,
with the break of the weekly support placed at 20577.60, and start it down to the target in area 19500.
A weekly closing above the 21170 would cancel the whole vision.

FTSEMIB Weekly, Pullback done?FTSEMIB Weekly, Pullback done?
Weekly that closes with a pullback of the bullish trendline broken the previous week;
This would call a forthcoming weekly bearish candle which could eventually release the index from the lateral phase that has been going for weeks,
with the break of the weekly support placed at 20577.60, and start it down to the target in area 19500.
A weekly closing above the 21170 would cancel the whole vision.

FTSEMIB starts up, but in the next hours probabily will start...FTSEMIB starts up, but in the next hours probabily will start the entry short (under 20970.48)
FTSEMIB Index-ADX / ADM-TS V 2.9.1 - Intraday Levels for 7/7/2017
ADM-Daily Daily Movement - Intraday Levels
Entry on close 1H (hourly candle) ... if exceeded the indicated level
LONG> 21197.90
TP1 = 21323.33
TP2 = 21445.98
TP3 = 21696.84
Stop Loss = 20970.48
SHORT <20970,480
TP1 = 20845.050
TP2 = 20722.400
TP3 = 20471.540
Stop Loss = 21197,900
On my blog,you'll find the detailed explanation of how these levels works ....

FTSEMIB entry short on departure at noonHe is prefiguring a downward afternoon on the Italian index
Entry on close 1H (hourly candle) ... if exceeded the indicated level
LONG> 21146.16
TP1 = 21273.15
TP2 = 21397.31
TP3 = 21651.28
Stop Loss = 20915.94
SHORT <20915.940
TP1 = 20788.950
TP2 = 20664.790
TP3 = 20410.820
Stop Loss = 21,146,160

FTSEMIB entry short on departure at noon
He is prefiguring a downward afternoon on the Italian index
Entry on close 1H (hourly candle) ... if exceeded the indicated level
LONG> 21146.16
TP1 = 21273.15
TP2 = 21397.31
TP3 = 21651.28
Stop Loss = 20915.94
SHORT <20915.940
TP1 = 20788.950
TP2 = 20664.790
TP3 = 20410.820
Stop Loss = 21,146,160

Weekly FTSEMIB
Weekly FTSEMIB that closes practically on the minimum of the previous week, biting it slightly.
It would be a slight short signal, but unconvinced, needs a confirmation next week.
What I see interesting is the breaking of the trendline (in red backbone)
That linked the departure of the lastes entr long signals. Another short signal.
Next week in the case of an initial start up I expect the pullback of the trendline , in zone 21000
If they start down immediately, the end of the lateral phase is decreed, taking the red channel path,
With first targetl in the 20000 area

Ftsemib settimanaleFtsemib settimanale pressochè invariato.. i punti di uscita dalla congestione laterale
sono la chiusura giornaliera sopra i 21271 per il long e sotto 20577 per lo short


