FBMKLCI Elliot analysisFrom the daily chart we can assume that the candle already break the major support. The conformation will be tomorrow candle, to see if they can come back from the support. If the klci can't came back from support it will be continue zigzag on arrow that i have been located. The completion is under Y on 0.5 or 0.618 of wave 2.
FBMKLCI trade ideas


FBMKLCI - (FTSE Bursa Malaysia) KLCI - Bullish TrendHumbled, we would like to thanks for your support who has already liked, commented and followed us.
Your support, strengthens us, to help in analyzing the market.
FBMKLCI - (FTSE Bursa Malaysia) KLCI - Bullish Trend

KLCI: Head and shoulder fully formedhead n shoulder fully form, next 1560 key point. if cant hold, back to 1520 or lower (probably another flash crash)
1560 is the point where h&s being held or not. (Reversal point)
Weekly Chart:


RISING WEDGE SIGN FOR A MARKET CRASH?Rising wedge is a bearish pattern that begins wide at the bottom and contracts as trading range narrows and the prices move higher. For a short term, the price might bullish and can consider to buy at price RM 1527 since the price in completing Wave D before it will moves to complete Wave E based on Elliot Wave structure. Last but not least, monitor the price action to minimise the risk when have an entry position and control money management.

Fall Two FloorsFBMKLCI will fall breaching below the 1600-point level and fall onto the major trendline (Support 2), corresponding with sma200 and will rebound higher.


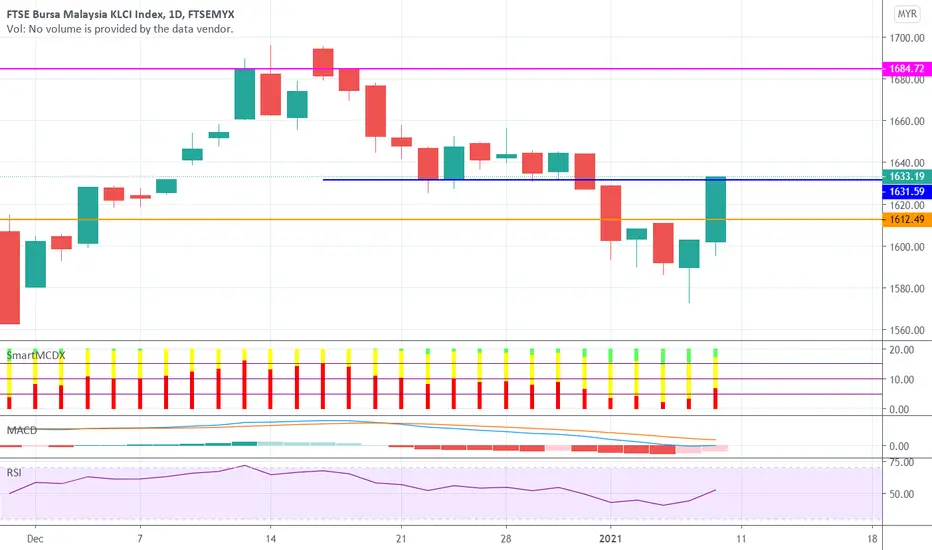
Weekly Index Review: FBMKLCILong logi form last week. Next week has to be close higher than 1631 confirm it is a morning loji star.

KLSE looking for major downtrendHello Traders
Here is quick analysis on KLSE. I'm projecting major downtrend if breaking Lower level

AIMING TO BREAK ALL TIME HIGH FOR BURSA MALAYSIA 1,800ptsRationally, Index is preparing to retest its all time high level just around Quarter 3 of 2021. That one is my rationale thought. If I'm too optimist, Index will break 2,000pts level by this year. Crazy enough? Its not crazy. This is rationale opinion when Politician is not around. Otherwise, they will be crazier than me.

Weekly Index Review: FBMKLCIMostly bring up by glove counters. In general market is still pessimistic with political and CV19 cases.


EARLY YEAR SALE JANUARY 20211572 Touch on Thursday 7/1/2021
MEGA SUPPORT 1548
Rebounce at 1572 will change the trend for rally starting 3rd-4th week of January 2021
Consumer Sector and Construction sector is on Aim.

KLCI - 50% retracement on Jan 7 Looking at the big picture, KLCI index should reverse it's direction and heading up after Jan 7.
Jan 7 is also a pressure date being it's 30 degrees from Oct 7 which is a turning point.
watch out for Jan 14 2021 as it's One year anniversary from Jan 14 2020 which is Gann's term 360 degrees (a full circle).

Weekly Index Review: FBMKLCIReaching near to its important support line 1613. Expecting gaining some momentum first before start the engine back.
Wish this 2021 year will be a recovery year.

Bursa Malaysia Main Index.Potential to test the Support in near term before bullish up to 2000pts for first time. Time range 1-2 years? Provided good political condition, strong economy climate.


Weekly Index Review: FBMKLCIPull back continuation lagging mainly by finance sector. Index 1612 will be very importance support.

Trend Analysis KLCI vs oil priceYTD, the trend of Malaysia KLCI Index and oil price moved like a parallel twin brothers. We know that oil price is negatively correlated to US currency so it is against most common belief that a strong US currency is good for our stock market as it will improve our exports. This phenomenon is really a mysterious puzzle :(

FBMKLCI, retrace after hitting the resistanceFBMKLCI as expected retraces after hitting resistance line.
Can it regain the momentum to break new high with 2 weeks left before 2020 year ended?

FBMKLCI / FTSE Bursa Malaysia Prediction. Where it will head up.Prediction 1 year from december 2020 - end of 2021.
