Is FTT token about to print a 400% move?On the above 5 day chart price action has corrected over 70% throughout 2024. A number of reasons now exist to be bullish. They include:
1) Price action and RSI resistance breakouts.
2) Trend reversal. Notice the higher low?
3) The trend reversal follows strong bullish divergence, which has now co
Related pairs

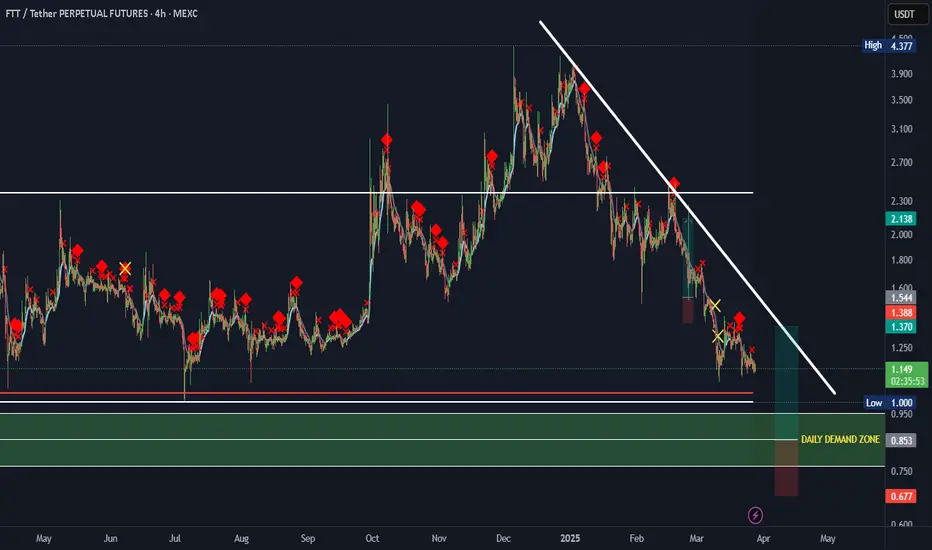
FTT Breakout soonWaiting for breakout this resistant line
You can buy some after breakout with a short -term target of at least 10%+.

FTTUSDT 1D AnalysisFTT ~ 1D Analysis
#FTT Buy gradually from here if you still have a Conviction on this coin with a short -term target of at least 15%+ from here.


FTT - LongThe main target is $1.89, the waiting time is 1-3 months, the asset analysis is kept secret
(Not an investment recommendation)

FTT LONG SETUP ALL trading ideas have entry point + stop loss + take profit + Risk level.
hello Traders, here is the full analysis for this pair, let me know in the comment section below if you have any questions, the entry will be taken only if all rules of the strategies will be satisfied. I suggest you keep thi
#FTX/USDT#FTX
The price is moving within a descending channel on the 1-hour frame, adhering well to it, and is heading for a strong breakout and retest.
We are seeing a bounce from the lower boundary of the descending channel, which is support at 1.23.
We have a downtrend on the RSI indicator that is abou

FTTUSDT UPDATEFTTUSDT is a cryptocurrency trading at $1.3195. Its target price is $3.0000, indicating a potential 100%+ gain. The pattern is a Bullish Falling Wedge, a reversal pattern signaling a trend change. This pattern suggests the downward trend may be ending. A breakout from the wedge could lead to a stron

FTTUSDT 1WFTT ~ 1W Analysis
#FTT Buy gradually from here with a short -term target of at least 20%+.

Breaking: FTT Has to Break This Price Levels to Start A BullrunThe defunct platform native token TSX:FTT has been on a falling wedge lately losing about 50% of value as the long lasting lawsuit against her founders most especially Sam Bankman-fried is showing no signs of ending.
The token has long been oversold with the RSI at 38.45 further solidifying our

See all ideas
Summarizing what the indicators are suggesting.
Oscillators
Neutral
SellBuy
Strong sellStrong buy
Strong sellSellNeutralBuyStrong buy
Oscillators
Neutral
SellBuy
Strong sellStrong buy
Strong sellSellNeutralBuyStrong buy
Summary
Neutral
SellBuy
Strong sellStrong buy
Strong sellSellNeutralBuyStrong buy
Summary
Neutral
SellBuy
Strong sellStrong buy
Strong sellSellNeutralBuyStrong buy
Summary
Neutral
SellBuy
Strong sellStrong buy
Strong sellSellNeutralBuyStrong buy
Moving Averages
Neutral
SellBuy
Strong sellStrong buy
Strong sellSellNeutralBuyStrong buy
Moving Averages
Neutral
SellBuy
Strong sellStrong buy
Strong sellSellNeutralBuyStrong buy
Displays a symbol's price movements over previous years to identify recurring trends.
Frequently Asked Questions
The current price of FTTUSDT SPOT (FTT) is 0.9039 USDT — it has risen 1.01% in the past 24 hours. Try placing this info into the context by checking out what coins are also gaining and losing at the moment and seeing FTT price chart.
FTTUSDT SPOT price has risen by 10.84% over the last week, its month performance shows a 2.04% increase, and as for the last year, FTTUSDT SPOT has decreased by −39.39%. See more dynamics on FTT price chart.
Keep track of coins' changes with our Crypto Coins Heatmap.
Keep track of coins' changes with our Crypto Coins Heatmap.
FTTUSDT SPOT (FTT) reached its highest price on Mar 28, 2022 — it amounted to 53.3000 USDT. Find more insights on the FTT price chart.
See the list of crypto gainers and choose what best fits your strategy.
See the list of crypto gainers and choose what best fits your strategy.
FTTUSDT SPOT (FTT) reached the lowest price of 0.6963 USDT on Jun 22, 2025. View more FTTUSDT SPOT dynamics on the price chart.
See the list of crypto losers to find unexpected opportunities.
See the list of crypto losers to find unexpected opportunities.
The safest choice when buying FTT is to go to a well-known crypto exchange. Some of the popular names are Binance, Coinbase, Kraken. But you'll have to find a reliable broker and create an account first. You can trade FTT right from TradingView charts — just choose a broker and connect to your account.
Crypto markets are famous for their volatility, so one should study all the available stats before adding crypto assets to their portfolio. Very often it's technical analysis that comes in handy. We prepared technical ratings for FTTUSDT SPOT (FTT): today its technical analysis shows the buy signal, and according to the 1 week rating FTT shows the sell signal. And you'd better dig deeper and study 1 month rating too — it's sell. Find inspiration in FTTUSDT SPOT trading ideas and keep track of what's moving crypto markets with our crypto news feed.
FTTUSDT SPOT (FTT) is just as reliable as any other crypto asset — this corner of the world market is highly volatile. Today, for instance, FTTUSDT SPOT is estimated as 2.10% volatile. The only thing it means is that you must prepare and examine all available information before making a decision. And if you're not sure about FTTUSDT SPOT, you can find more inspiration in our curated watchlists.
You can discuss FTTUSDT SPOT (FTT) with other users in our public chats, Minds or in the comments to Ideas.