FTTUSDT is testing a key levelThe price is testing the daily support at 26$ area inside a ascending channel on the main descending one.
How to approach it?
IF the price is going to lose the support and retest it as new resistance, According to Plancton's strategy , we can set a nice order
–––––
Keep in mind.
🟣 Purple structure -> Monthly structure.
🔴 Red structure -> Weekly structure.
🔵 Blue structure -> Daily structure.
🟡 Yellow structure -> 4h structure.
–––––
Follow the Shrimp 🦐
FTTUSDT trade ideas

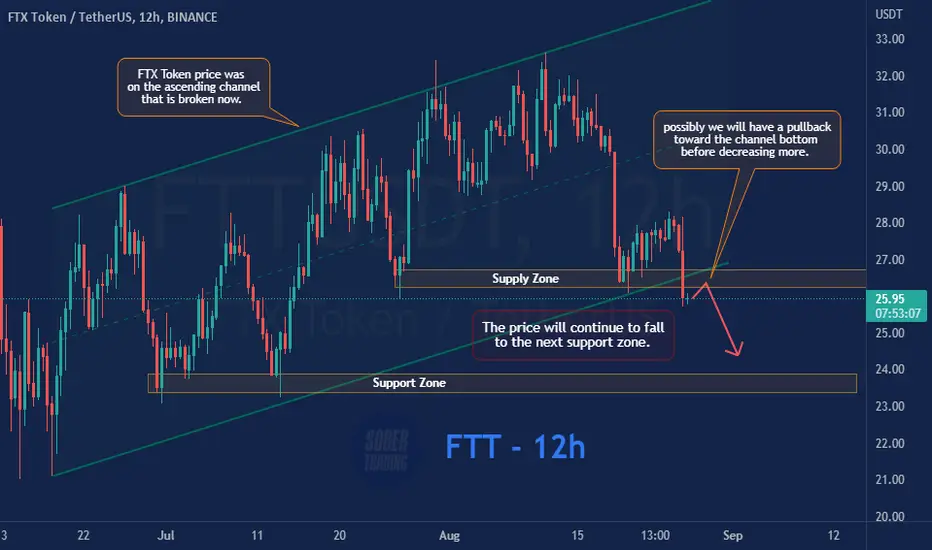
FTT - FTX Token 12h bearishFTX Token price was on the ascending channel that is broken now. So the price will continue to fall to the next support zone, and possibly we will have a pullback toward the channel bottom before decreasing more.
FTTUSDT | WEDGE BROKENFTTUSDT has broken the rising wedge. Currently price is trading below the lower wedge . We are watching out for retest for resistance zone.
A downward break from the range will call for more bears and price action may fall to horizontal support zone .However bullish trend will only be above the break of horizontal resistance zone .
Trade your levels accordingly.

$FTT (Log)- Correction unlikely done here. But looks promising. This is one of my bluechip coins and has been for sometime. I miss the first move up and I don't intend to let that happen again.
Some big CT accounts are calling for sub 10$ prices. While I can understand the confluence, I still see a support well above that level. With the extended 3rd wave, I do see a good reason to bounce around the 19$ range. I see the waves clearly on this coin and I'll be tempted to short into my bias at some point in the near future. I see us finishing waves ii/Ⓨ/(C)/5 with the current 5 wave impulsive or diagonal structure. WXY is clear as day from the top of ⑤.
Safe trades to all of you. Don't forget your SL.

FTX Mid-term technical analysisA lot of good R:R short setups across the crypto market.
For the FTX, there is a clear invalidation level (tight SL), and the risk to reward of at least 4 for this short setup.
Let's see how it will play.
Cheers!
Mr. Cfyptotracker

FTTUSDTFTTUSDT(08.16.2022 UPDATED)
Wait until price touches the trend lines then look for signal bar and key bar /Breakout and pullback to recognize direction of price movement.
Money Management must be obeyed.
Open position without setting the proper stop loss (1% or 2% of total balance ) soon or late will cause to lose all your money ( call margin )
Majority of trades is done via computer trading (forex / cryptocurrency)
priority in analyzing charts:
1- Price Action
2- Market structure
3- Chart patterns
4- Candlestick patterns
5-Divergence
6-Indicators

The best position to sell fttusdtHi guys
If you loss to get the at the top its another chance to get sell or increas your volume and move your stop loss
we have the good base and the volume shows us that level is the good S&R
any way i like to know your idea too

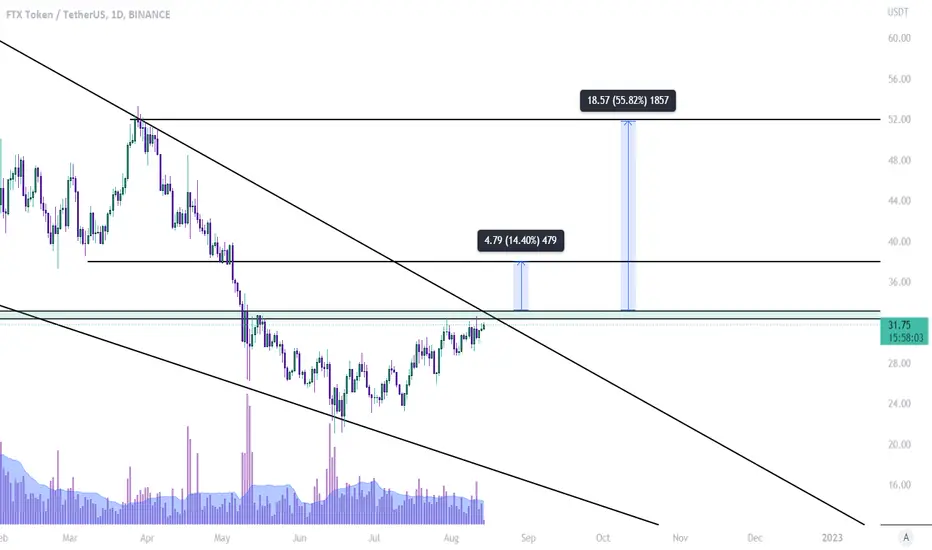
What a base on FTX! 2 targets inside🚀Hi friends! Another crypto giant creates a huge base (or accumulation range) to skyrocket soon!
More about the base were in this idea! Check it to get more experience in trading.
Now FTX inside in the triangle and queeze to the top boundary. It`s a bullish signal but almost all altcoin depends on BTC. If BTC will break the 25k and move to 27-28k FTX is easilly reach this targets:
1. $38.5-40 - the closest value area and resitance for the price
2. $48.5 - the key level and reversal point
🚩 The big players (whales) accumulate FTX at the bottom as we can see at the chart.
📊 Here are the preconditions to open a long:
🔥 suqeeze to the trendline
🔥 whales orders to buy which DOM and Footprint indicators show
🔥 possible trap (shake out) to collect long traders sl
🔥 bullish BTC help FTX to reach all the targets
💻Friends, press the "boost"🚀 button, write comments and share with your friends - it will be the best THANK YOU.
P.S. Personally, I open an entry if the price shows it according to my strategy.
Always do your analysis before making a trade.

FTTUSDT |Coin Review| uplinkHello trader Today I prepared a new idea for you. Like and subscribe to the channel there is a lot of useful information✅
Friends today we have FTT coin (FTX token) for parsing
There is an expectation that we will bounce from the upper borders of the channel to the support zone, I think it will not be bad to gain a position from these values.
Of course, I don’t believe so much in the breakdown of the channel, so I will erase fixing from the upper borders of the pattern, and then look at the breakdown.

FTX FTT - Strong altcoin! Huge base + Elliott Wave
FTT is a very reliable and strong altcoin that you can find on the crypto market, together with BNB.
FTX exchange is growing really fast, and there is a lot of demand for the token. If you want reliable and stable gains, this is a great choice for the long term.
We have a clear and very bullish structure (rectangle consolidation) and the bulls successfully defended the previous swing low.
My Elliott wave analysis suggests that we have completed an ABC correction (ZigZag 5-3-5) and we are prepared for the next impulse wave from here!
If we take a look at the volume indicator, we can see very low bearish pressure, so it's really good to see.
Our profit target could be 0.618 FIB extension from Wave 1 -> Wave 2, but I think we can go higher. We need to wait for the price to develop.
I expect tremendous gains for selected altcoins. You can find them in the related section down below.
For more ideas, please hit "Like" and "Follow"!

FTT/USDT BUYING SETUPFTT Breakout Major falling wedge pattern wait for daily close for confirm valid breakout or false break. if we see in 4h timeframe now FTT on strong resistance potential rejected back to retest on 4h demand before back to trying breakout the resistance . in 4h demand at the time support the trendline
Entry : 31.4 - 29.2 - 27
Target : 37 - 42.31 - 47.98 - 53
Stop : 25.6

FTTUSDT DFTT is making a big rising wedge but the market pump lot these days but its not bad to put ftt in watch list .

#FTT/USDT - Long - Potential 22.05% #FTT/USDT - Long - Potential 22.05%
Exchanges: FTX, Binance, Huobi.pro, KuCoin
Signal Type: Regular (Long)
Entry Targets:
1) 29.29 - 100.0%
Take-Profit Targets:
1) 30.47 - 50%
2) 32.17 - 30%
3) 35.74 - 20%
Stop Targets:
1) 25.76 - 100.0%
Entry Trigger - Bullish divergence with RSI oversold, wave oversold on support with multiple pullback entry triggers.
Trailing Configuration:
Entry: Percentage (0.0%)
Take-Profit: Percentage (1.0%)
Stop: Breakeven -
Trigger: Target (1)

Is this not telling us something ?Now one of the things I look at in the "buy the dip " market is how much can an asset go back up, after dropping so far ? I read and see charts telling me much larger assets have dropped by 85-90 %, so I expect that some of them may return to these ATH's. But what is with this asset, as right now it has only dropped by 53%. Is there something special about this coin that it didn't drop as far as the others ? Is it a super-resilient asset ? Does it have super powers ? Now,, who created this asset ? What is their business ? Will it surpass it's all time high, while other slug coins, too heavy to rise, flounder and do nothing in comparison?
Call it fundamentals, but I think its worth investigating. I could be wrong, but the moon could be made of swiss cheese too ?
The Sublime Prince of the Mystic Brotherhood

FTTUSDT Analysis (Local Vision)Hello friends.
Please support my work by clicking the LIKE button👍(If you liked). Also i will appreciate for ur activity. Thank you!
Everything on the chart.
Entry: market and lower
Target: 36 and ~40
after first target reached move ur stop to breakeven
Stop: ~26 (depending of ur risk). ALWAYS follow ur RM .
Risk/Reward: 1 to 3
risk is justified
Good luck everyone!
Follow me on TRADINGView, if you don't want to miss my next analysis or signals.
It's not financial advice.
Dont Forget, always make your own research before to trade my ideas!
Open to any questions and suggestions.

FTX Coin analysis; FTTUSDT Update 📈📉HEY, what's up guys ?!
Since 19 Dec 2021, as I expected for FTT , after breakout upward channel it has been declining till now!
So today as you see on the weekly timeframe again for FTT /USDT , after a little consolidation phase around current support zone , recently printed a weekly bullish candle ,plus revealing some positive divergences , now it can continue to rise more, so in this case if it be able to breakout the descending trend line it can reach the higher resistance zones, but then I expect a possible rejection at there !. but if it losses the current S zone it may see the lower support zone!
✌️ Good luck with your trading and investing and remember: Trade smart…OR JUST DON’T TRADE!
--------------------------------------------------------------------------------------------------------------------
👉This analysis is my personal opinion ,not a financial advice ,so do your own research.
💚 if you're fan of my analyses please follow me , give a big thumbs 👍 OR drop a comment 🗯


FTT (will history repeat itself ?)FTT / USDT
After bearish phase there are accumulation phase then bullish phase
Just look at FTT in (late July and early August 2021)
And compare it with current price action
Its looks the same start, same price action with same support and even same months !! Thats a great fractal with one year ago
Will history repeat itself ?
Very high potential

FTTUSDT | IMPORTANT ZONEFTTUSDT has been trading near the resistance zone . The previous data shows price took a beat from same zone. The last few candles formation shows a consolidation near the resistance zone .
The bulls need to break above the resistance zone and price must to sustain above that zone. While bears will be active at resistance zone and also break below the rising support.
Trade your levels accordingly.

FTT : Long term bearish but a good game for short termFTX token is in our radar right now as the price of this token is now trending slightly above the crucial support of $23 which is becoming the last defending area to maintain the bullish structure in higher degree.
Price is now trending inside of this parallel channel which it's highly affected by the bitcoin's current price action. However, we still see possibility for the price to show us another upside pump to the area of $37 because of current extreme oversold condition in the market.
We are very confident to see the possibility of moving up in upcoming structure which the area of $37 is needed to be touched for making this as a healthy bearish structure.
Overall bias on current structure is to test the area of $8.7 which is very bearish on long term. But for short term, it's still a good game to expect upside spike to $37.

FTTUSDT Swing Trade setup!FTTUSDT Technical analysis update.
FTTUSDT is currently trading at 29.40
FTT price braking resistance zone after 2 months of consolidation and price multiple times touched its resistance zone. we can expect an up move in FTT.
Thanks
Hexa.

FTT TOKEN , RETEST —> PUMPMy thoughts on FTT are bullish , buy here on the retest. First target is 40$. Have to break 31$ first.
In my opinion FTT is highly undervalued.No financial advice.
