FTT ShortBearish div on H4 and H1, already started to move down.
Would short but not on futures on KuCoin
FTTUSDT trade ideas

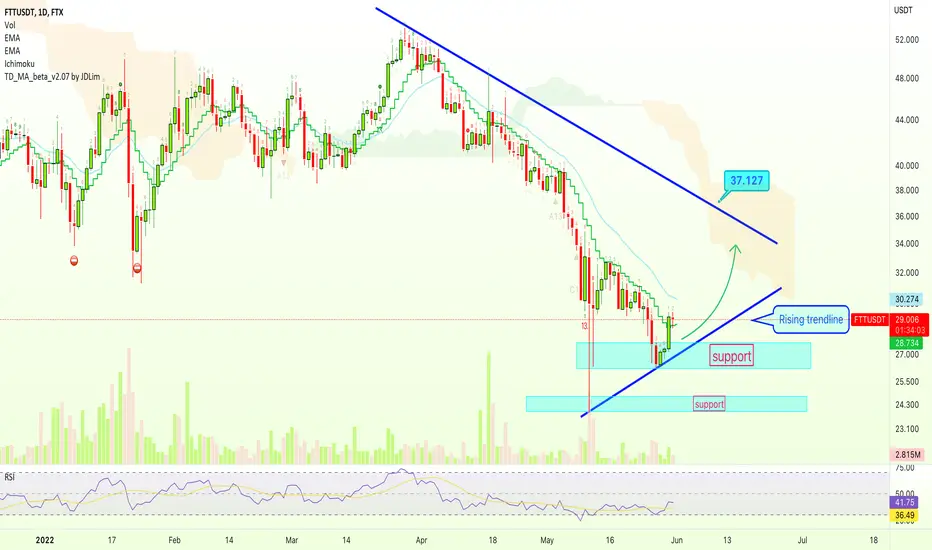
FTX Token (FTT) Chart Analysis + Target & Support LevelsWe can see that FTTUSDT (FTX Token) managed to break above EMA10 on negligible volume... Which isn't really good but, once we have a bounce start to develop, we can see the counter-trendline being challenge, this is mapped on the chart.
We stay bullish above the "rising trendline".
We turn/switch/adapt to bearish below "support".
We aim at $35-$37 as bullish target on the next jump.
Namaste.
FTT great future ahead :) Fundamentals:
+ FTT native token with endless possibilities
+/- Relatively Risk-Off token within the crypto industry. This does not mean it should survive crypto winter better than others, but it is more of a relatively "Safe" opportunity.
Opinion:
FTX native token. The possibilities are endless.
This is not intended or made to constitute any financial advice.
Notes on how I personally use my charts/NFA:
Each level L1-L3 and TP1-TP3 has a deployment percentage. The idea is to flag these levels so I can buy 11% at L1 , 28% at L2 and if L3 deploy 61% of assigned dry powder. The same in reverse goes for TP. TP1: 61%, TP2:28% and TP3:11%. If chart pivots between TP's, in-between or in Between Sell levels these percentages are still respected. I like to use the trading range to accumulate by using this tactic.
Just my personal way of using this. This is not intended or made to constitute any financial advice.
This is not intended or made to constitute any financial advice.
FED Macro Situation Consideration:
All TP's are drawn within the context of a return to FED neutral policy. I do not expect these levels to be reached before tightening is over.
NOT INVESTMENT ADVICE
I am not a financial advisor.
The Content in this TradingView Idea is for informational purposes only, you should not construe any such information or other material as legal, tax, investment, financial, or other advice. Nothing contained within this idea constitutes a solicitation, recommendation, endorsement, or offer to buy or sell any securities or other financial instruments in this or in in any other jurisdiction in which such solicitation or offer would be unlawful under the securities laws of such jurisdiction.
All Content on this idea post is information of a general nature and does not address the circumstances of any particular individual or entity. Nothing in the idea/post constitutes professional and/or financial advice, nor does any information on the idea/post constitute a comprehensive or complete statement of the matters discussed or the law relating thereto. You alone assume the sole responsibility of evaluating the merits and risks associated with the use of any information or other Content on the idea/post before making any decisions based on such information.

FTTUSDT- UpTrend LineFTTUSDT- UpTrend Line. Very bullish. Showing same signs as done in the past. Keep an eye on it. it would definitely make ATH in 1st quarter 2022
Happy New Year
FTTUSDT - SETUPFTTUSDT price hit the last hope where strong support lies. If bulls gain some volume and momentum we could see a strong pull back and after crossing the previous high and trendline we may see an upward surge.

FTT/USDTFTT / USDT
Hello friends.
As shown in the chart, it is located inside a descending triangle and on the other hand, its long-term uptrend line is broken.
It is expected to rise in the $ 41 range and close its pullback and then fall to the $ 20 range.
#FTT #KUNA #BTC #ETH #DOGE #SHIB

FTTUSDTHello Crypto Lovers,
Mars Signals team wishes you high profits.
This is a one-day-time frame analysis for FTTUSDT
Obviously, the price was able to rise again when it touched the first support line. At the moment, it is fluctuating between the first support line and the first resistance line. We expect two scenarios for the price. If it has a weakness it its trend, it will face more decline up to the second support line. But if it is able to move above the first resistance line, then it will continue its trend toward the second resistance line and we would see more rise in it.
Warning: This is just a suggestion and we do not guarantee profits. We advise you analyze the chart before opening any position.
Wish you luck

FTTUSDTOpportunity in FTTUSDT. Trading is serious business and it carries a high level of risk and may not be suitable for all investors. Do your own due diligence before putting your funds to work on anything; you should make yourself an expert. There will be up to date ideas. So be kind enough to follow me on Trading view & Twitter for more updates. Feel free to direct message if you need further clarification. Investors are welcome for 50% Profit Share.

FTTUSDTHello Crypto Lovers,
Mars Signals team wishes you high profits.
This is a one-day-time frame analysis for FTTUSDT
After passing a rise and down trend, now the price is fluctuating in its support zone. The existence of this butterfly rising pattern reveals that the price will rise again. So if it is supported, it will move toward the first resistance line.
Warning: This is just a suggestion and we do not guarantee profits. We advise you analyze the chart before opening any position.
Wish you luck

FTT bull caseFTX Token is trying to break out of this falling wedge (yellow) and may be forming Inverted Head and Shoulders🤷 on the Daily timeframe. If price breaks the falling wedge upper edge and then the Neckline I think there is chance for run to 68 and even higher. Actually in anticipation of this happening I'm already looking for buy signals on lower timeframe (2h) and I see another potential Inverted Head and Shoulders in the making:
Once the Neckline of this smaller iH&S (2h)☝️ is broken I will set the BUY LIMIT order to catch the pullback to Neckline (testing it from above) as shown on the 2h TF picture.
ENTRY : Backtest of the broken Neckline (2h) @ 43.5
STOPLOSS (SL) : Right Shoulder (iH&S Daily) = Head (iH&S 2h) @ 37.3
TARGETS (TP) : Inverted H&S target projections @ 49.5 & 68
REWARD RISK RATIO (RRR) : 1 & 4
INVALIDATION : when SL level hit
Check my other stuff in related ideas.
Please like👍, comment🗣️, follow me✒️, enjoy📺!
⚠️Disclaimer: I'm not financial advisor. This is not a financial advice. Do your own due dilingence.

FTT / USDTAs you can see in 4H time frame we are in this pattern , and we have bullish divergence on RSI
I do trading based on patterns and zones
Enter the market based on your strategy for making it short or long
this is not financial advice
use stop loss

FTT/USDTPossible breakout is near! Pros: $FTT is forming a diamond bottom reversal pattern. Should spike to $60 Cons: Lack of volume

FTT buy signal FTT can create a buy area in the area 43.7_42, long-term compaction is quite evident in the price and fundamentally ftt has a high accumulation among the seedlings, in addition to the accumulation of support lines of channels can be seen in this range. Profit limit: 61.35
Stop Loss : Fixed below 37

FTTUSDTHello Crypto Lovers,
Mars Signals team wishes you high profits.
This is a 4-hour-time frame analysis for FTTUSDT
The price could move over the resistance line but this was unsuccessful. We believe it can move to the resistance line again after it reaches the support line. In case the price moves below the support line, it will face more fall. Please don't forget the stop-line point.
Warning: This is just a suggestion and we do not guarantee profits. We advise you to analyze the chart before opening any positions.
Wish you luck


FTX Token FTTUSDT
Weekly time frame
Entries and Targets on the chart
Long Term View
not financial advice

FTT/USDTFTT received short signal on binance 45m chart pattern.
Don't Rush Posibilited price will pump more , because when signal hit 100 present then more pump chances increases so patience required .
Not a Financial Advise
Hit Like

FTT 4h resistance breakout + RSI DIVERGENCEa good 1D closure above the 4h resistance level , with this RSI bullish divergence would be a signal good enough for me to enter this with a good long which would see 48 (and 51) as targets
stop loss around 41
let me know what you think about this
+ follow and like for more please!!

Special analysis of FTT FTT In the 40$ -38$ range, it has good support, buying in this range can be very low risk.

FTT USDT bullish flag above a weekly resistance FTT USDT bullish flag above a weekly resistance with a head and shoulder

FTX Token FTTUSDT - Ascending triangle breaking out! New leg up- FTT token is very bullish on the higher time frames.
- Currently the price is breaking out of an ascending triangle - one of the most bullish patterns.
- Also we have a descending channel breakout, which indicates us bullish trend reversal.
- Next profit target is the all time high level, but in my opinion it will go much higher.
- The price is now finally above 200 daily moving average.

FTTUSDTHello Traders
Here is a beautiful setup which price has break from an important level , then it back for retest. Break and retest strategies are common and mostly used by traders because it has very good R:R ratio and WinRate.
Good luck
